Open Access
Fig. 7.
Download original image
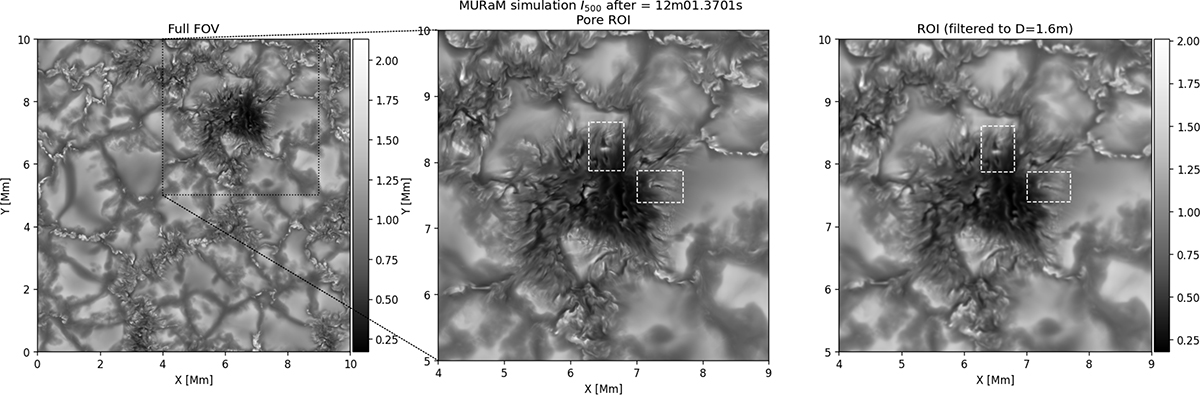
Continuum-intensity snapshot of the MURaM simulation at the optical surface τ500 = 1. Left: Complete simulation domain. Middle: Zoom of the pore. Right: Zoom filtered to a diffraction-limited frame from an ideal 1.6 m telescope. The white rectangles mark the locations of the striations and grains shown in Figures 8 and B.2.
Current usage metrics show cumulative count of Article Views (full-text article views including HTML views, PDF and ePub downloads, according to the available data) and Abstracts Views on Vision4Press platform.
Data correspond to usage on the plateform after 2015. The current usage metrics is available 48-96 hours after online publication and is updated daily on week days.
Initial download of the metrics may take a while.