Fig. 8.
Download original image
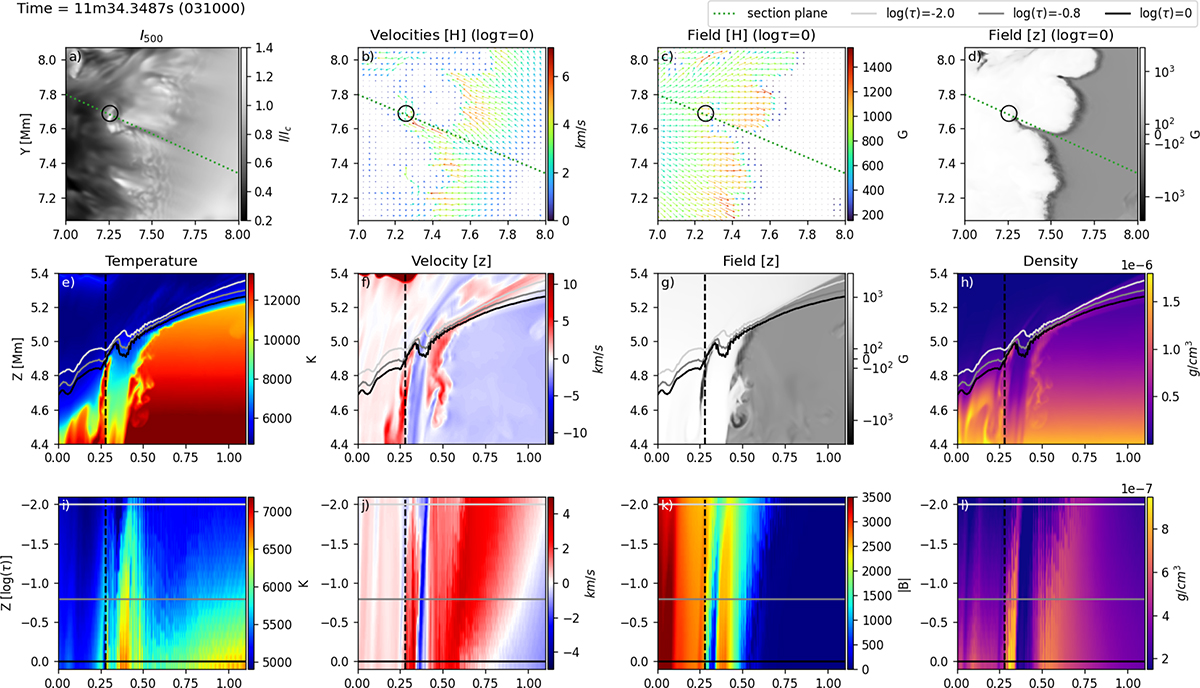
Cut through a grain in a MURaM simulation. Top row: (a) Continuum intensity at 500 nm and the horizontal (b) velocities and (c) field as vector maps, and (d) the vertical field strength, all at log(τ) = 0. All tick marks are in Mm. Middle row: Cuts along the dotted green line indicated in the top row. We plot the temperature (e), vertical velocity (f), vertical field (g) and density (h). All tick marks are in Mm. Bottom row: Vertical cuts through the same quantities as in panels (e)–(h), again along the dotted green line, but with the vertical axis now given in optical depth between log(τ) = 0 and log(τ) = −2, which is similar to the optical depth range covered by the atmospheres obtained from the observations. The tick marks on the x axis are in Mm, tick marks on y axis in log(τ). We adjusted the sign of the vertical flows in all panels to match inversion results, and thus negative values along the z-axis denote an up-flow and positive z-velocities denote a down-flow. The simulated grain is marked with a black circle in panels (a–d) and with a vertical dashed line in panels (e–l). An animated version of this Figure is available as an online movie.
Current usage metrics show cumulative count of Article Views (full-text article views including HTML views, PDF and ePub downloads, according to the available data) and Abstracts Views on Vision4Press platform.
Data correspond to usage on the plateform after 2015. The current usage metrics is available 48-96 hours after online publication and is updated daily on week days.
Initial download of the metrics may take a while.