Fig. 1.
Download original image
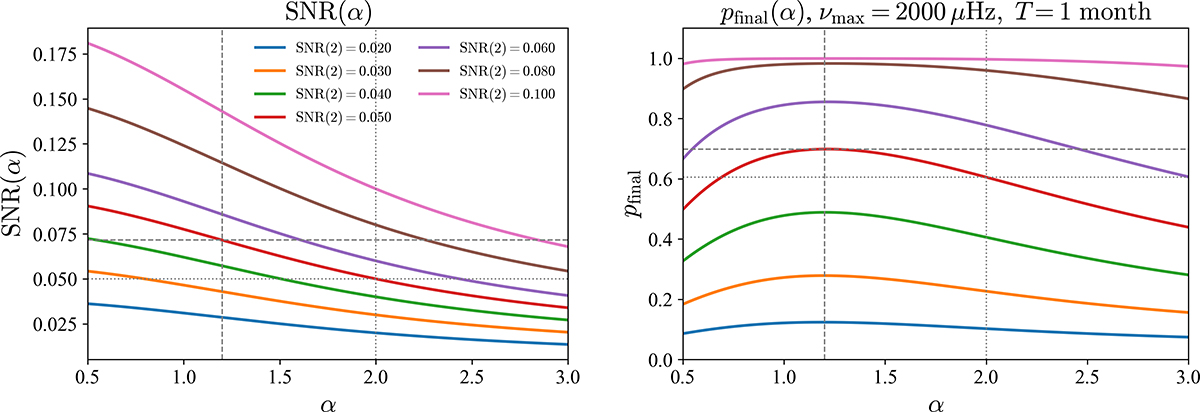
Left: Variation in SNR values with α for different assumed values of SNRtot(2)∈[0.02, 0.10] (see plot annotation), with the vertical dotted line marking the standard value of α = 2 and the vertical dashed line marking the optimal value of α ≃ 1.2. The corresponding horizontal dotted and dashed lines mark the intersection with the red curve, having SNRtot(2) = 0.050. Right: Corresponding detection probabilities, pfinal, for νmax = 2000 μHz and T = 1 month.
Current usage metrics show cumulative count of Article Views (full-text article views including HTML views, PDF and ePub downloads, according to the available data) and Abstracts Views on Vision4Press platform.
Data correspond to usage on the plateform after 2015. The current usage metrics is available 48-96 hours after online publication and is updated daily on week days.
Initial download of the metrics may take a while.