Fig. E.1.
Download original image
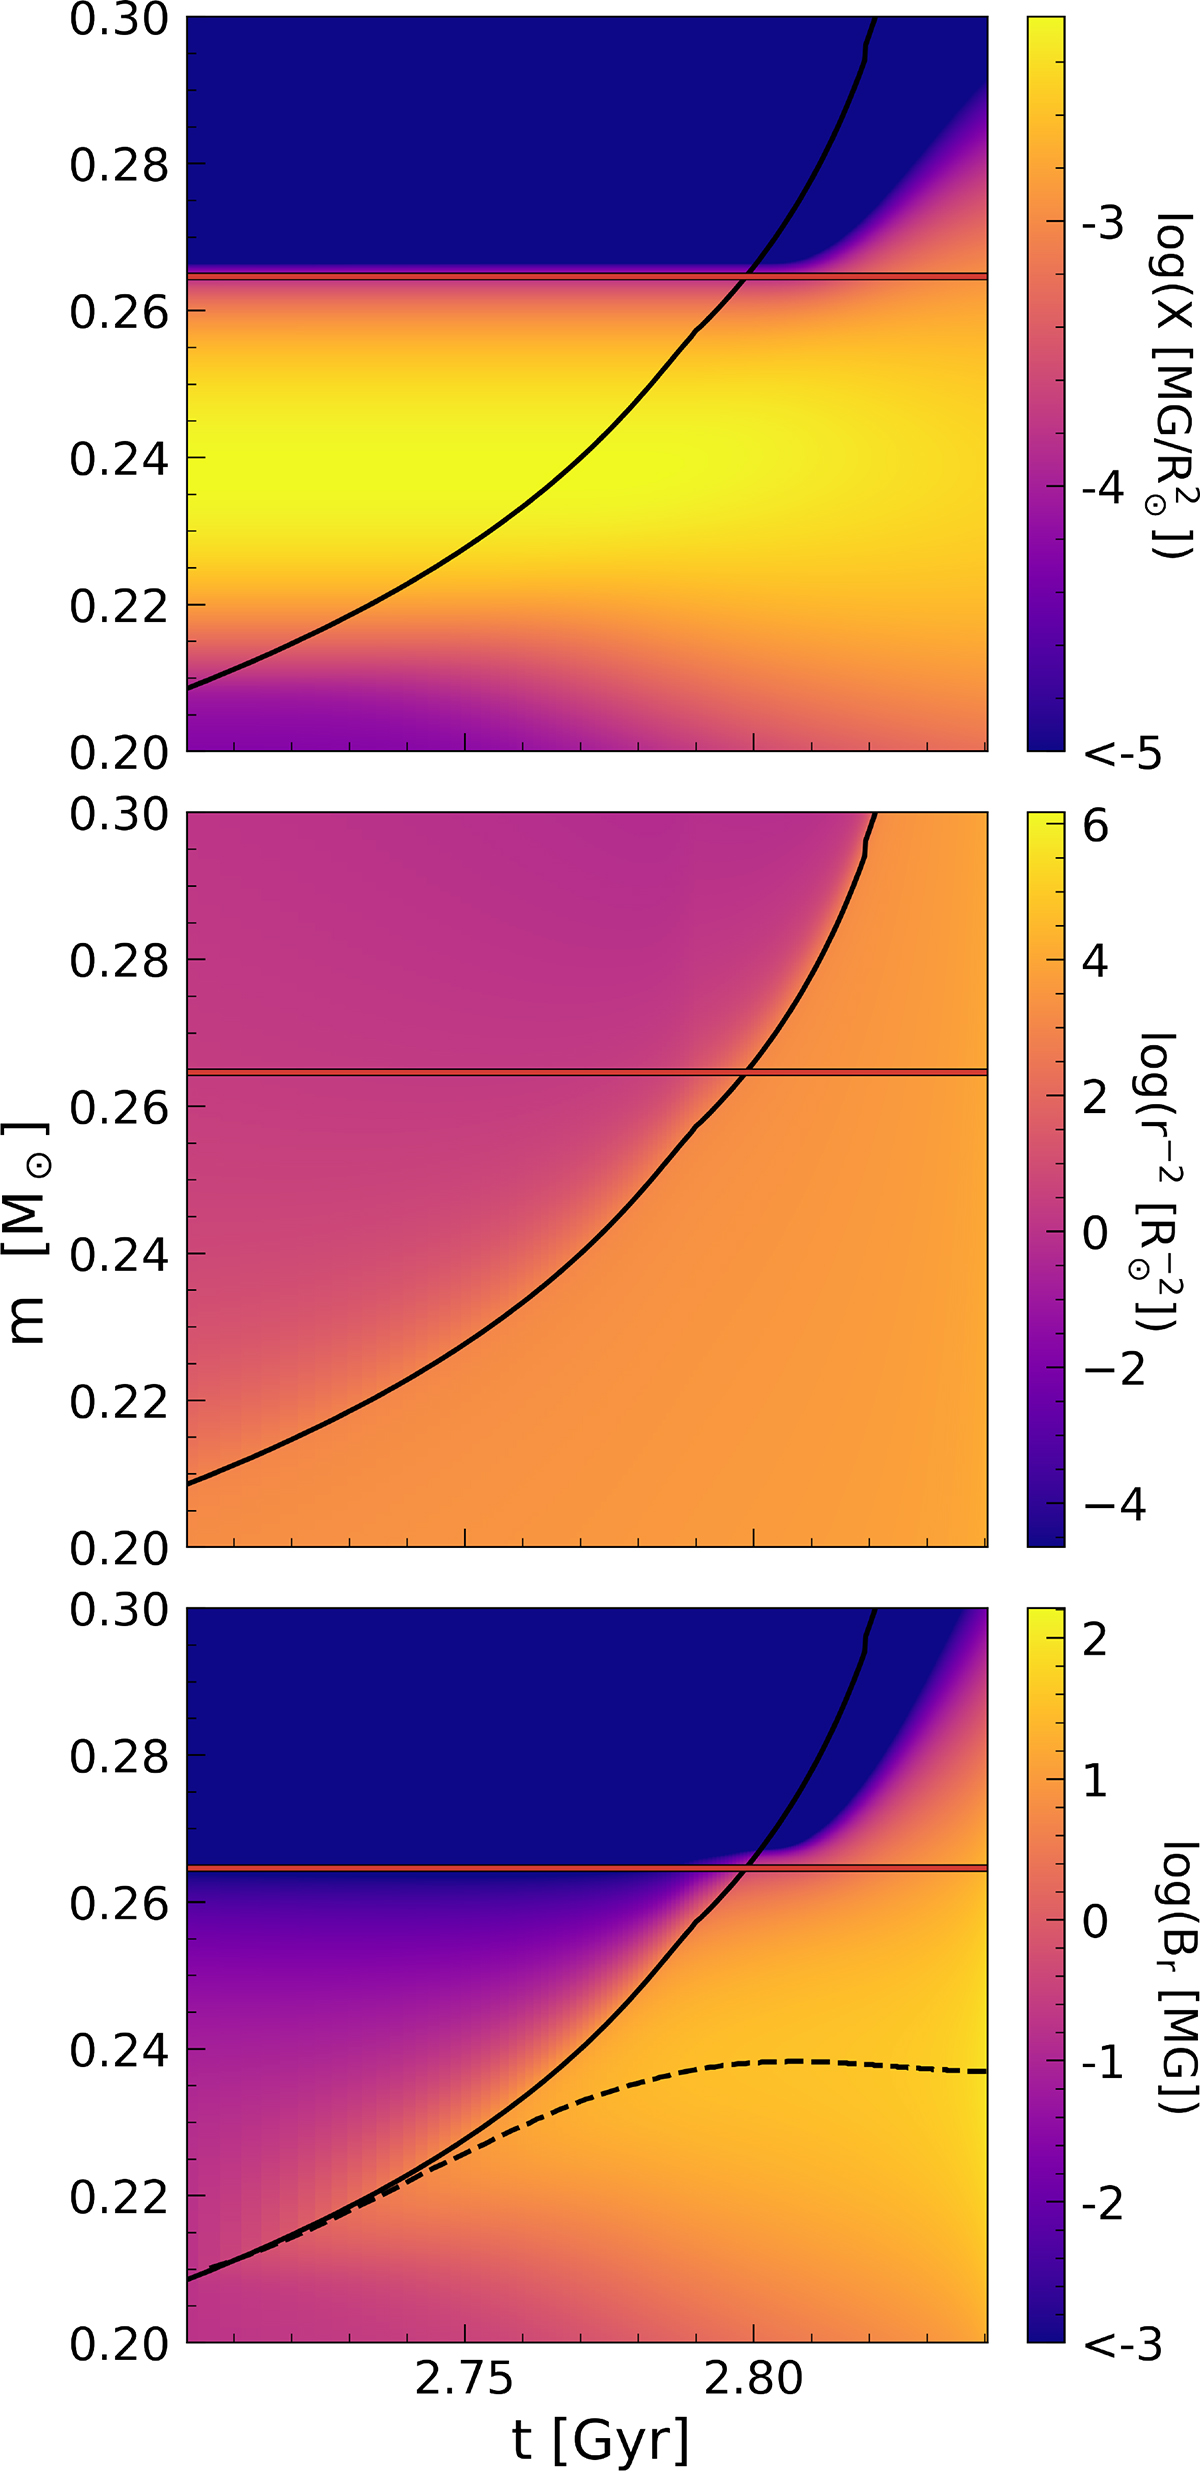
Evolution of Scenario C during the RGB around the H-shell (solid black line). The magnetic mass ℳC ∼ 0.26M⊙ is shown as a solid red line. Left: Contour map of the magnetic flux in log-scale as it evolves according to Eq. D.17. Middle: Contour map of r−2 in log-scale. Right: Contour map of br in log-scale as a result of multiplying the two panels above. The dashed black line shows the location of the maximum of br.
Current usage metrics show cumulative count of Article Views (full-text article views including HTML views, PDF and ePub downloads, according to the available data) and Abstracts Views on Vision4Press platform.
Data correspond to usage on the plateform after 2015. The current usage metrics is available 48-96 hours after online publication and is updated daily on week days.
Initial download of the metrics may take a while.