Open Access
Fig. E.2.
Download original image
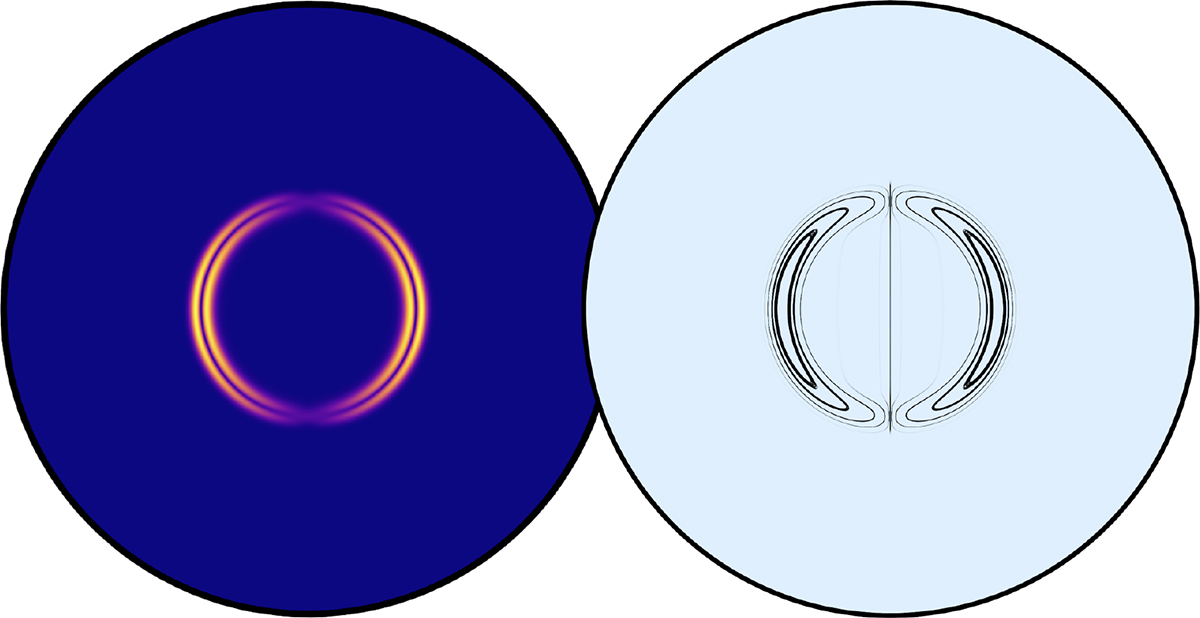
2D slice of the magnetic field of Scenario C at the start of the WD cooling sequence. Left: Local magnetic field strength ![]() throughout the full WD. The yellow region shows where most of the magnetic field strength is located. Right: Corresponding field lines to the same magnetic field shown on the left.
throughout the full WD. The yellow region shows where most of the magnetic field strength is located. Right: Corresponding field lines to the same magnetic field shown on the left.
Current usage metrics show cumulative count of Article Views (full-text article views including HTML views, PDF and ePub downloads, according to the available data) and Abstracts Views on Vision4Press platform.
Data correspond to usage on the plateform after 2015. The current usage metrics is available 48-96 hours after online publication and is updated daily on week days.
Initial download of the metrics may take a while.