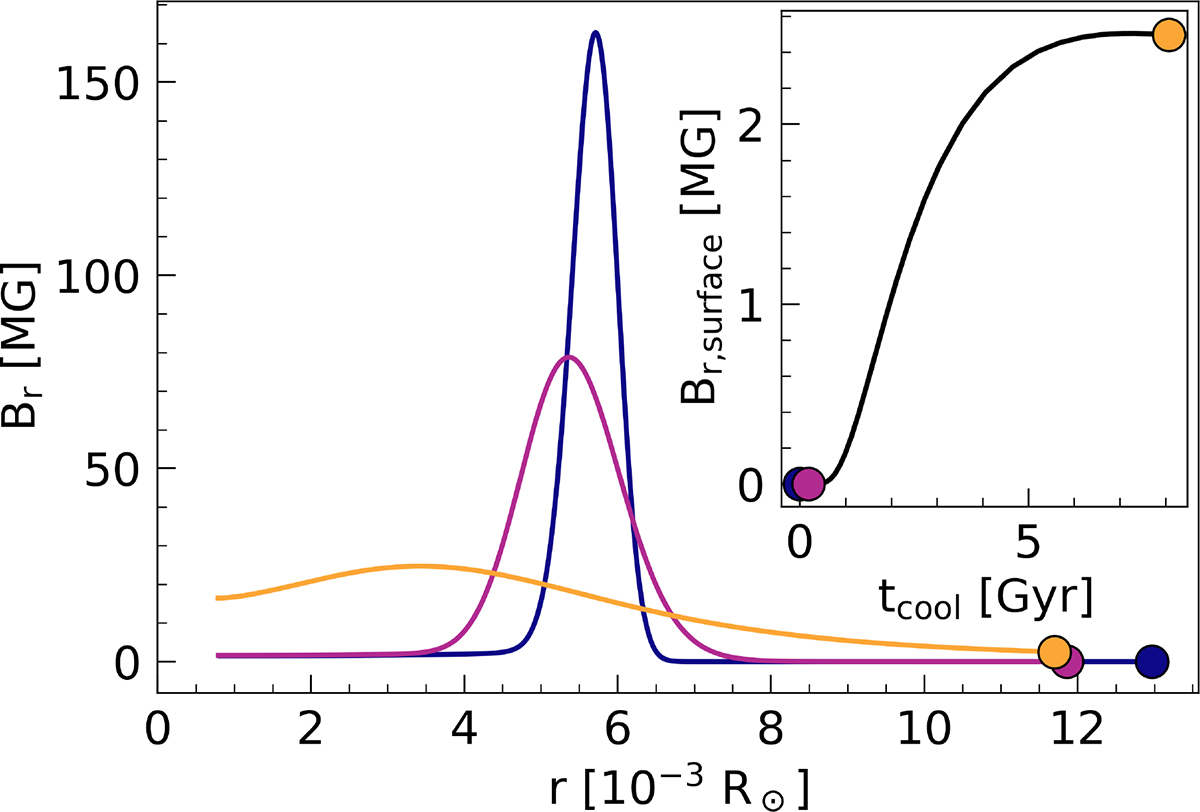
Fig. F.1.
Download original image
Evolution of Scenario C along the WD cooling sequence. Left: Br as a function of radius for three different cooling ages: tcool = 0Gyr (dark blue), tcool = 0.2Gyr (purple), and tcool = 8Gyr (yellow), with the colored circles emphasizing the current field strength at the surface. Right: Br at the surface of the WD as a function of cooling age. The three colored circles correspond to the surface field strength of the three radial profiles in the left panel.
Current usage metrics show cumulative count of Article Views (full-text article views including HTML views, PDF and ePub downloads, according to the available data) and Abstracts Views on Vision4Press platform.
Data correspond to usage on the plateform after 2015. The current usage metrics is available 48-96 hours after online publication and is updated daily on week days.
Initial download of the metrics may take a while.