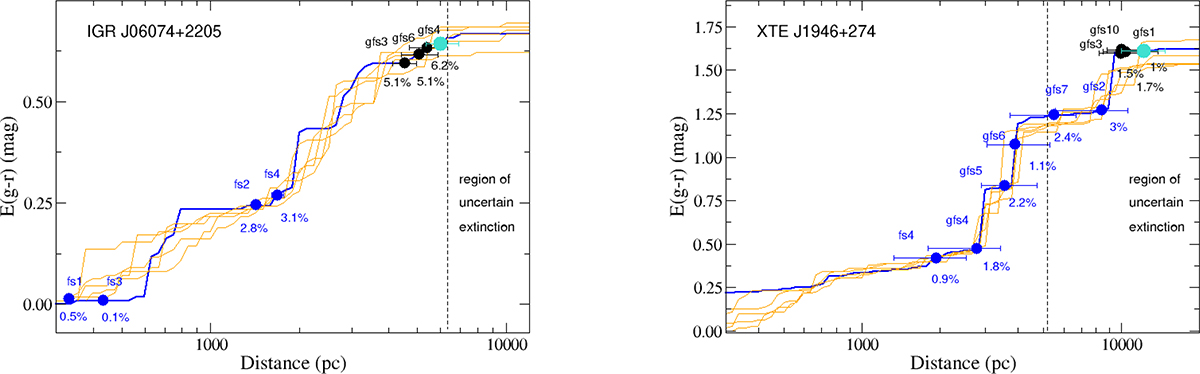
Fig. 2.
Download original image
Two representative examples of extinction as a function of distance (data from Green et al. 2019). Data points mark the assumed locations of the stars on the extinction curve, based on their distances; they do not imply extinction values. Distances are from Bailer-Jones et al. (2021). The turquoise circle represents the BeXB, the black circles show the field stars used for the ISM correction, and the blue circles correspond to other field stars. We also indicate the polarization degree (PD) of the field stars. The vertical dashed line marks the region of uncertain extinction.
Current usage metrics show cumulative count of Article Views (full-text article views including HTML views, PDF and ePub downloads, according to the available data) and Abstracts Views on Vision4Press platform.
Data correspond to usage on the plateform after 2015. The current usage metrics is available 48-96 hours after online publication and is updated daily on week days.
Initial download of the metrics may take a while.