Open Access
Fig. 7.
Download original image
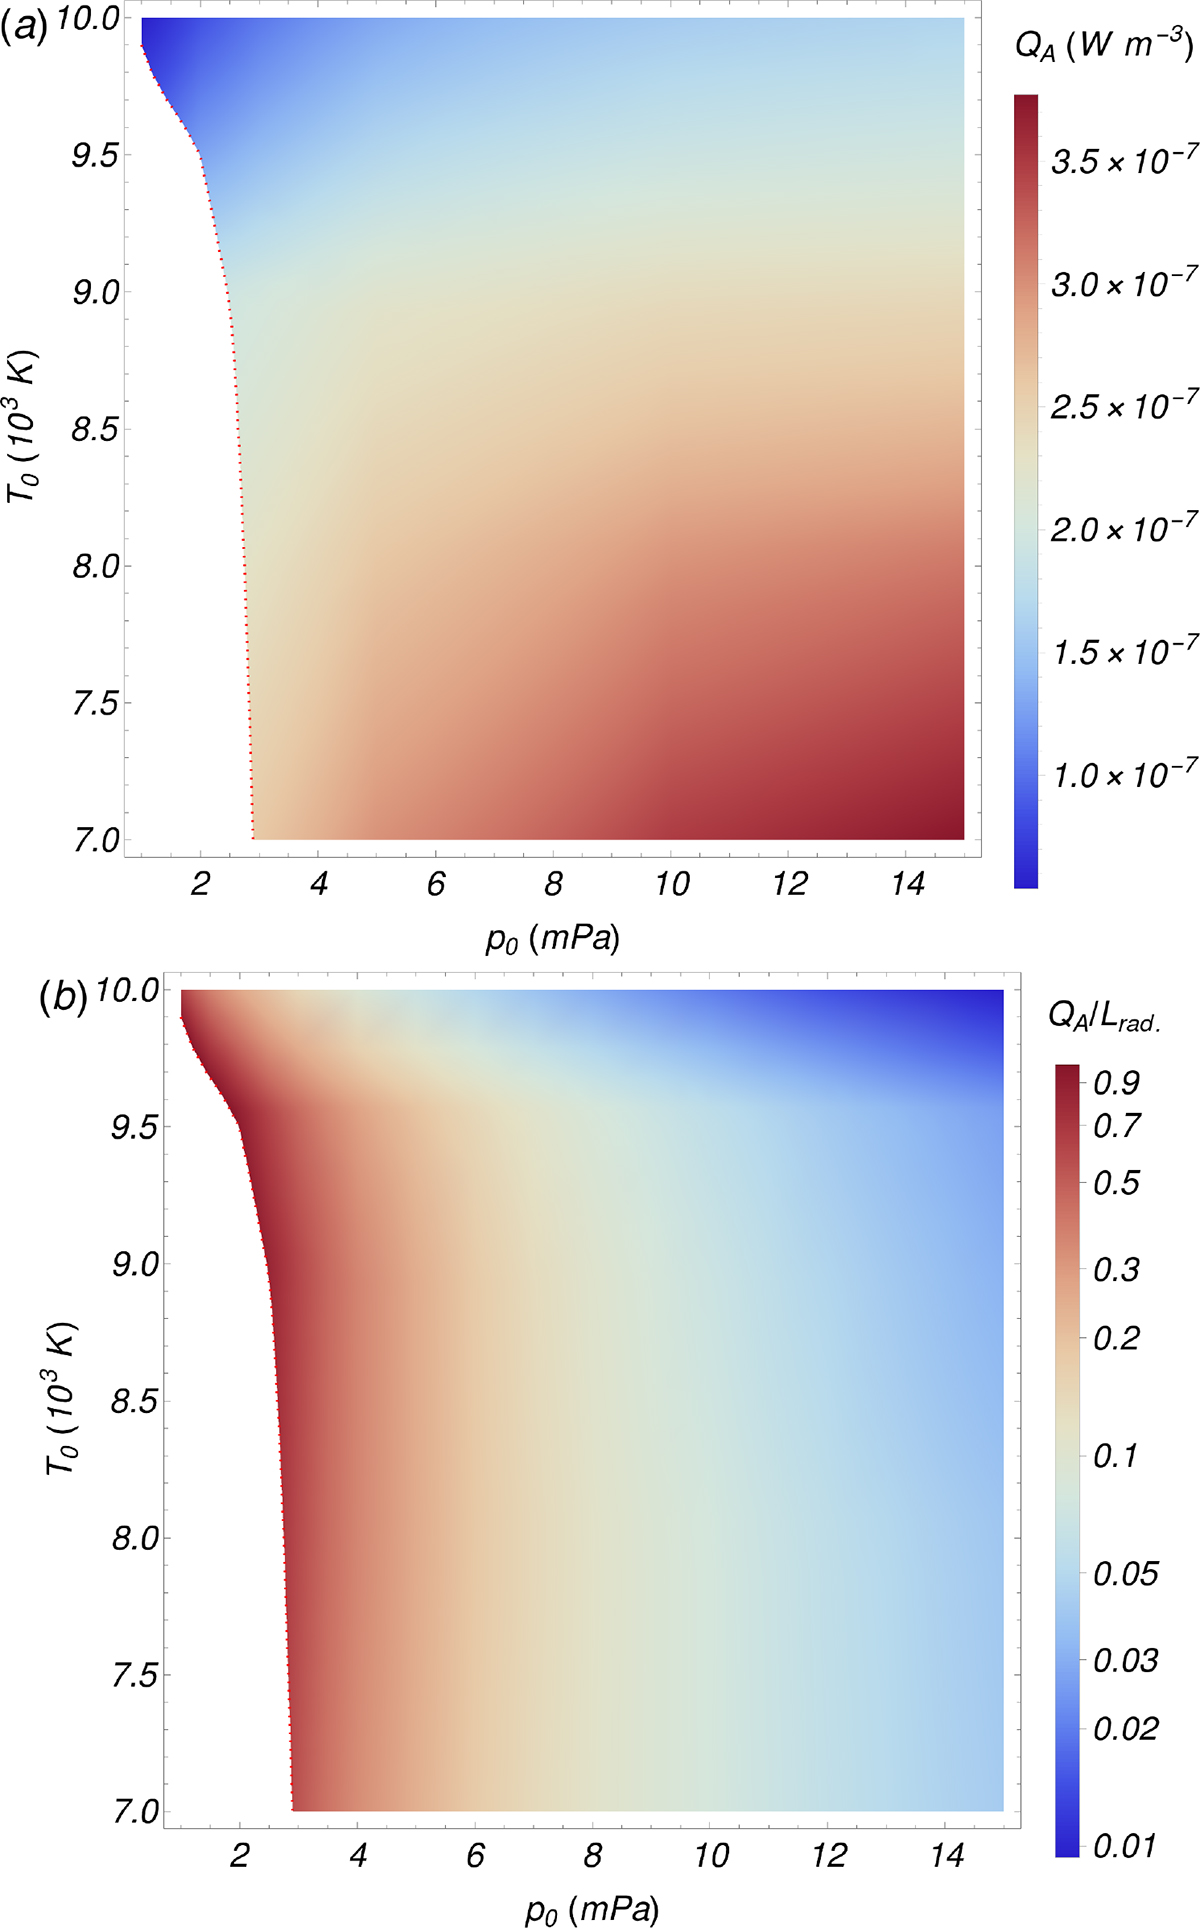
Contour plots of the ambipolar heating at the center (upper panel) and the ratio between heating and cooling at the center (lower panel), as functions of T0 and p0. The color range in the upper panel is in lineal scale, whereas the lower panel is in logarithmic scale.
Current usage metrics show cumulative count of Article Views (full-text article views including HTML views, PDF and ePub downloads, according to the available data) and Abstracts Views on Vision4Press platform.
Data correspond to usage on the plateform after 2015. The current usage metrics is available 48-96 hours after online publication and is updated daily on week days.
Initial download of the metrics may take a while.