Fig. 1
Download original image
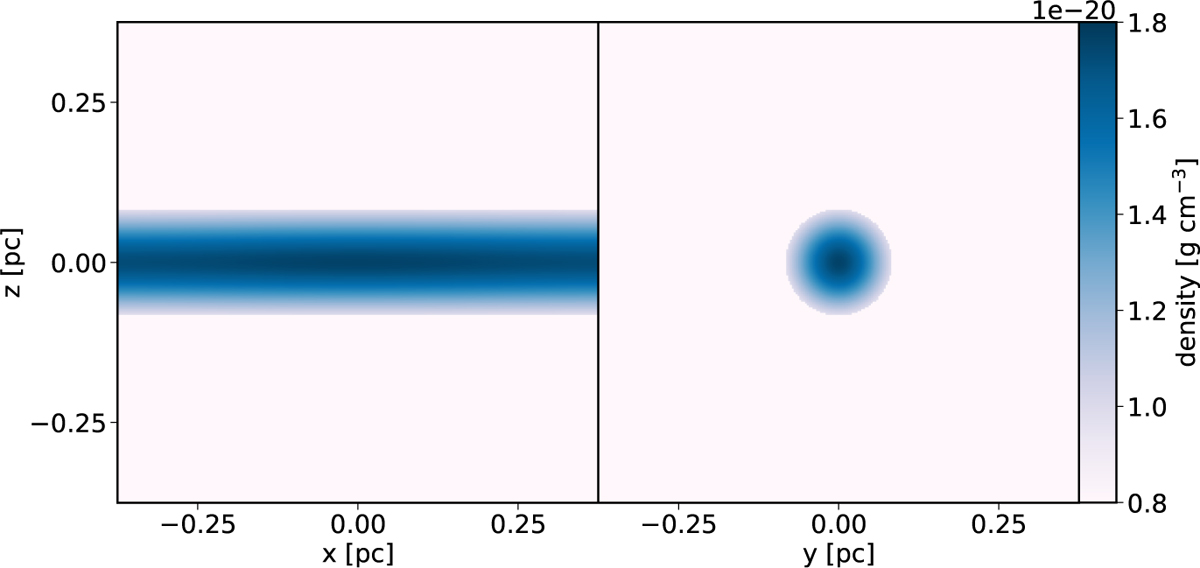
Example of the filament orientation within the simulation box. Shown here on the left-hand side is a slice along the filament axis at y = 0.0 pc and a slice perpendicular of the filament at x = 0.0 pc on the right-hand side. This particular filament has a line-mass of fcyl = 0.25 and a perturbation on the dominant wavelength, which is also the size of the box.
Current usage metrics show cumulative count of Article Views (full-text article views including HTML views, PDF and ePub downloads, according to the available data) and Abstracts Views on Vision4Press platform.
Data correspond to usage on the plateform after 2015. The current usage metrics is available 48-96 hours after online publication and is updated daily on week days.
Initial download of the metrics may take a while.