Fig. 10
Download original image
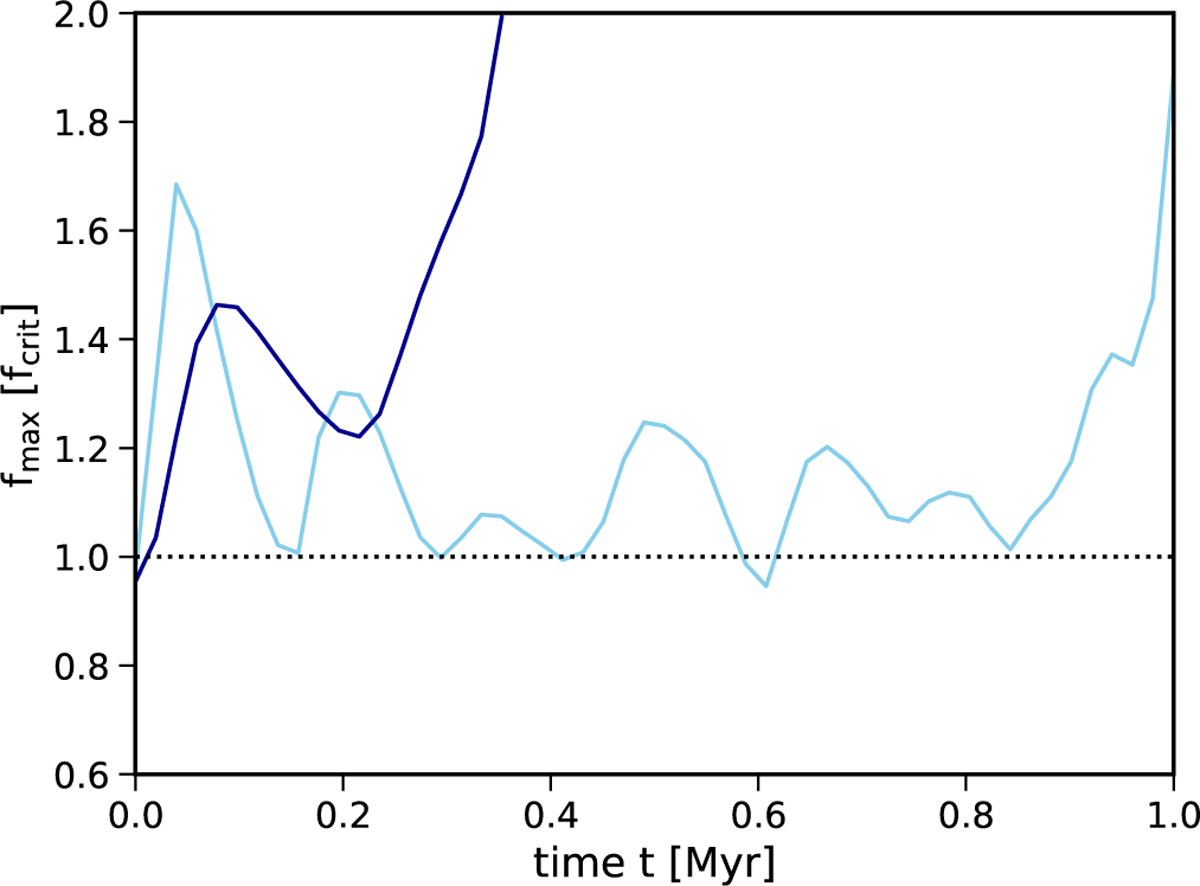
Evolution of the maximum line-mass in the simulation of a filament of fcyl = 0.9 for a perturbation wavelength of three times shorter, shown in light blue, and 2.22 times shorter, shown in dark blue, than the dominant wavelength. In the former case the core does not collapse directly but the line-mass oscillates with values above the critical line-mass until eventually a single collapsing core forms on the dominant wavelength.
Current usage metrics show cumulative count of Article Views (full-text article views including HTML views, PDF and ePub downloads, according to the available data) and Abstracts Views on Vision4Press platform.
Data correspond to usage on the plateform after 2015. The current usage metrics is available 48-96 hours after online publication and is updated daily on week days.
Initial download of the metrics may take a while.