Fig. 4
Download original image
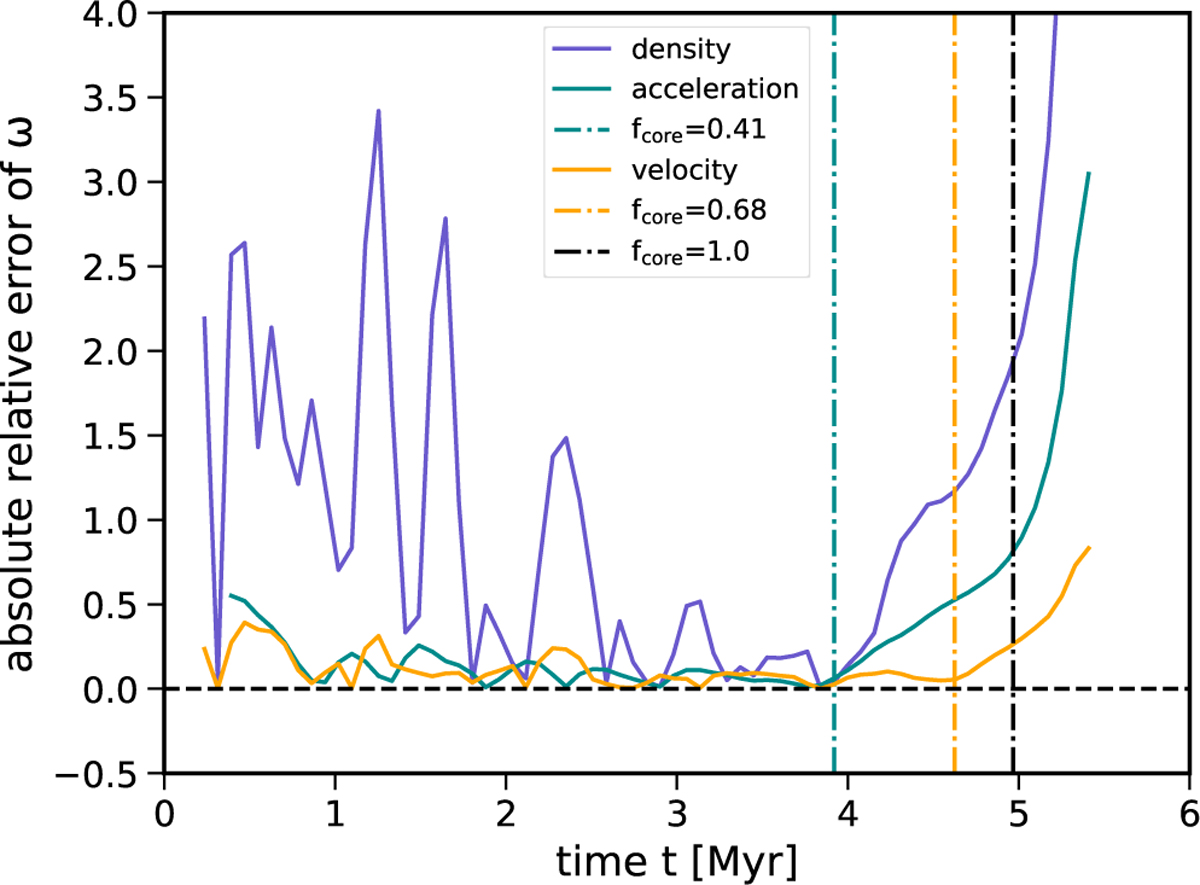
Time evolution of the absolute relative error of the growth time scale ω measured in the simulation for a line-mass of fcyl = 0.25. The solid blue, cyan, and orange line shows the error of the density, x-acceleration and x-velocity, respectively. We define the beginning of the non-linear evolution by determining the point in time when the error exceeds a value of 5% when measuring back from the end of the simulation. The thresholds are indicated by the vertical dashed-dotted lines, for which we also determine the line-masses at the position of the core, which are given in the legend.
Current usage metrics show cumulative count of Article Views (full-text article views including HTML views, PDF and ePub downloads, according to the available data) and Abstracts Views on Vision4Press platform.
Data correspond to usage on the plateform after 2015. The current usage metrics is available 48-96 hours after online publication and is updated daily on week days.
Initial download of the metrics may take a while.