Fig. 5
Download original image
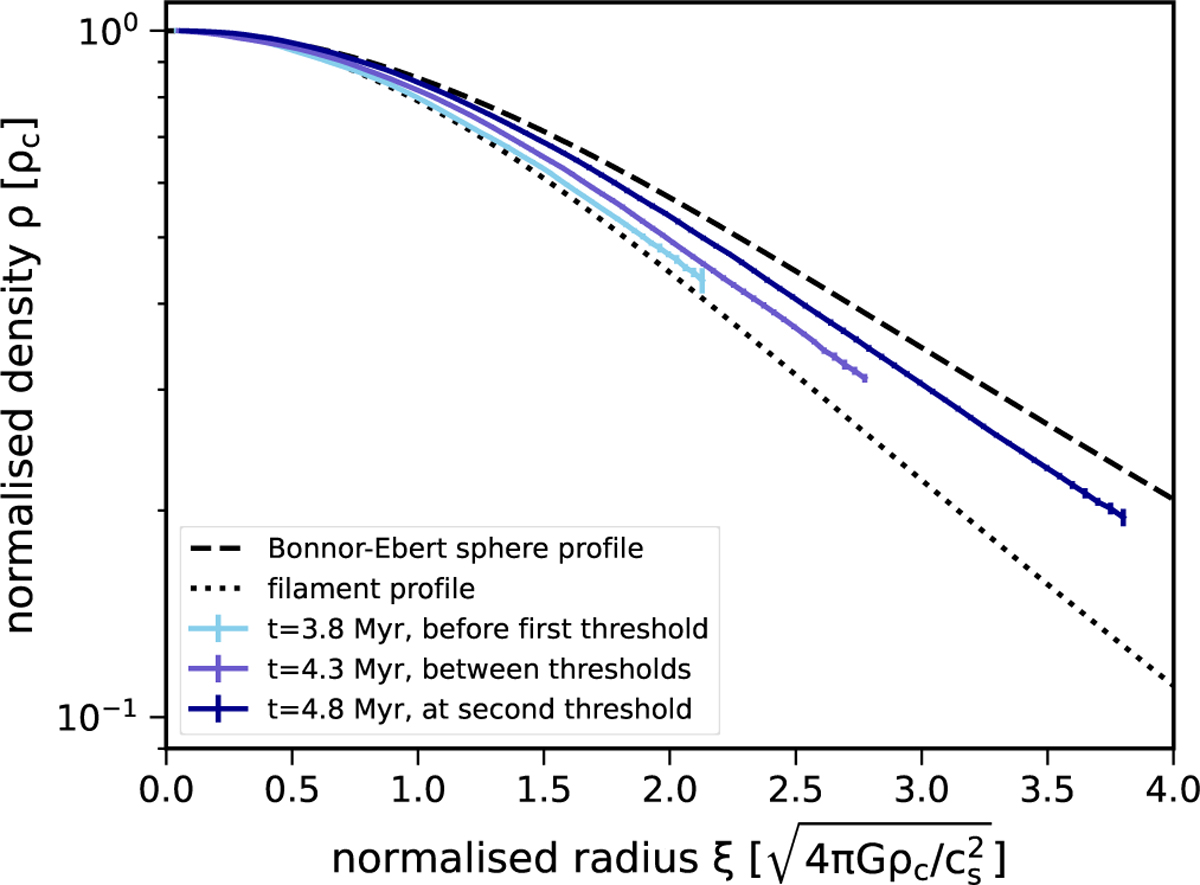
Evolution of the radial density profile of the core from the linear growth phase until the start of the collapse for a line-mass of fcyl = 0.25. Shown are snapshots before the first threshold in light blue, between the first and second threshold in blue, and just after the second threshold in dark blue. The density and the radius are normalised to a dimensionless form to compare profiles with different concentrations. The filament profile as defined in Eq. (5) is given as a dotted line and the Bonnor-Ebert sphere profile as a dashed line.
Current usage metrics show cumulative count of Article Views (full-text article views including HTML views, PDF and ePub downloads, according to the available data) and Abstracts Views on Vision4Press platform.
Data correspond to usage on the plateform after 2015. The current usage metrics is available 48-96 hours after online publication and is updated daily on week days.
Initial download of the metrics may take a while.