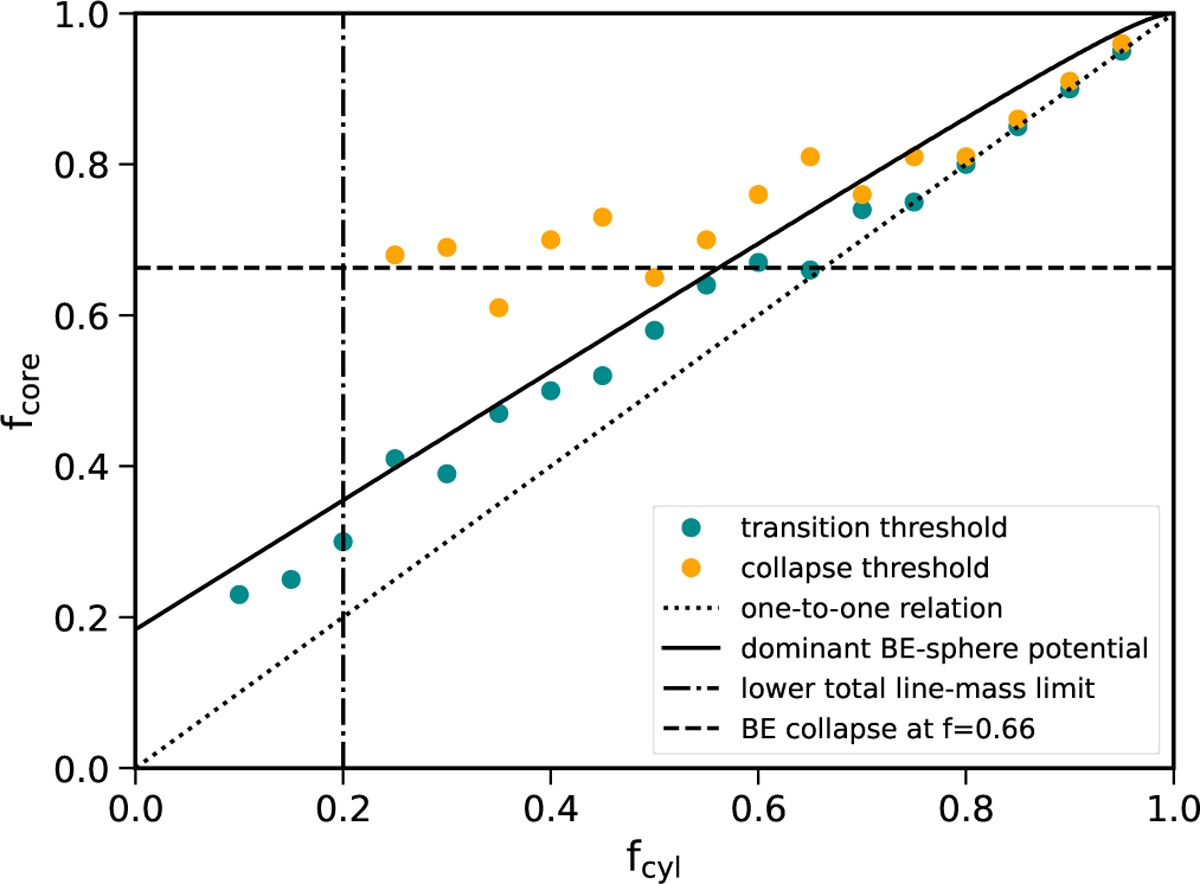
Fig. 6
Download original image
Threshold line-masses at the position of the core in dependence of the filament line-mass fcyl. The beginning of the non-linear evolution in acceleration is given by the cyan points, for the velocity by the orange points. The solid line indicates where the Bonnor-Ebert sphere potential dominates over the filament potential. The vertical dashed-dotted line shows the lower mass limit for a collapsing Bonnor-Ebert sphere and the horizontal dashed line shows the result of calculating the maximum supported Bonnor-Ebert mass assuming a external pressure given by the density within the filament.
Current usage metrics show cumulative count of Article Views (full-text article views including HTML views, PDF and ePub downloads, according to the available data) and Abstracts Views on Vision4Press platform.
Data correspond to usage on the plateform after 2015. The current usage metrics is available 48-96 hours after online publication and is updated daily on week days.
Initial download of the metrics may take a while.