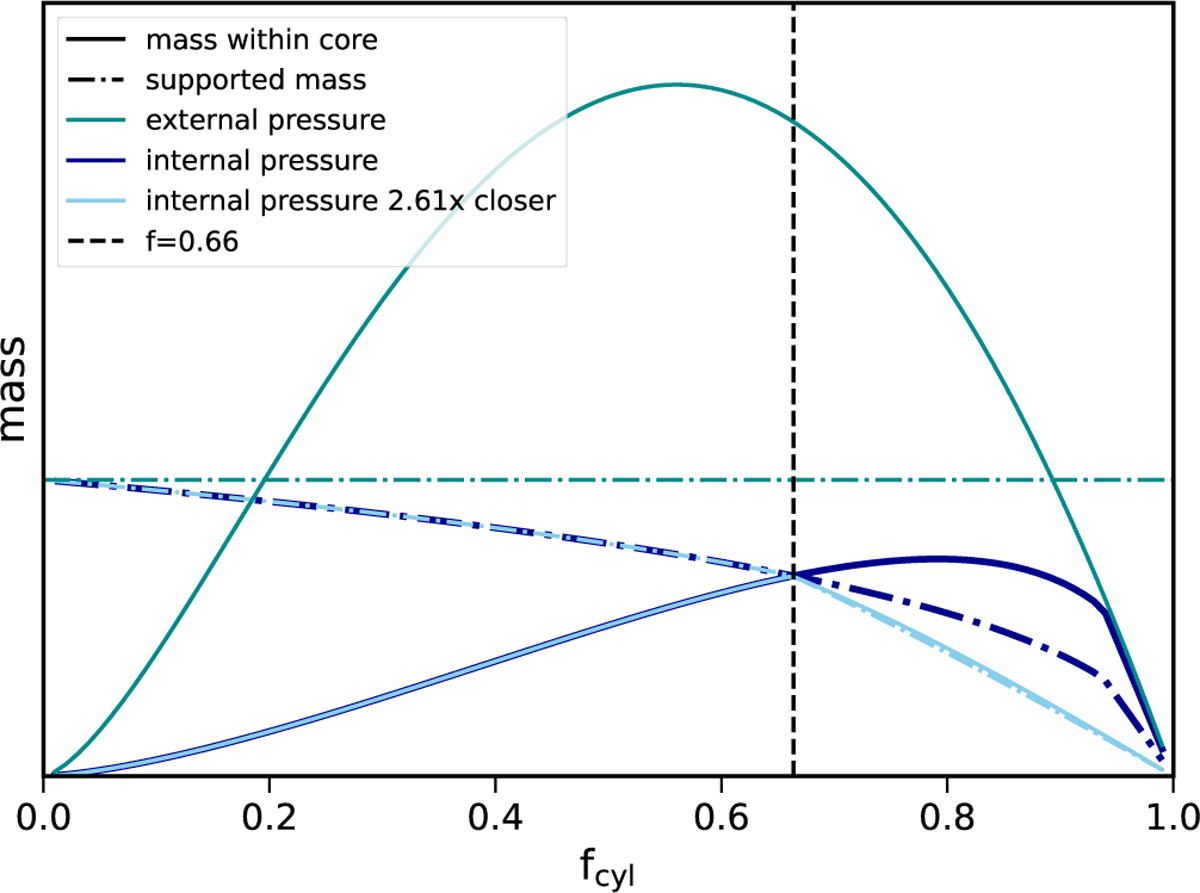
Fig. 7
Download original image
Comparison of the mass within a core, given by the solid lines, to the supported Bonnor-Ebert mass, given by the dashed-dotted lines, as function of the line-mass. The cyan lines show the model of only taking the external pressure into account where the core mass is given by the total mass of the dominant wavelength. The dark blue lines show our model of a spherical core located within a filamentary density profile where cores become unstable for line-masses above fcyl = 0.66, as marked by the vertical dashed line. The light blue lines show the closest separation the cores can have while still being unstable, which is 2.61 times closer than the dominant wavelength.
Current usage metrics show cumulative count of Article Views (full-text article views including HTML views, PDF and ePub downloads, according to the available data) and Abstracts Views on Vision4Press platform.
Data correspond to usage on the plateform after 2015. The current usage metrics is available 48-96 hours after online publication and is updated daily on week days.
Initial download of the metrics may take a while.