Fig. 9
Download original image
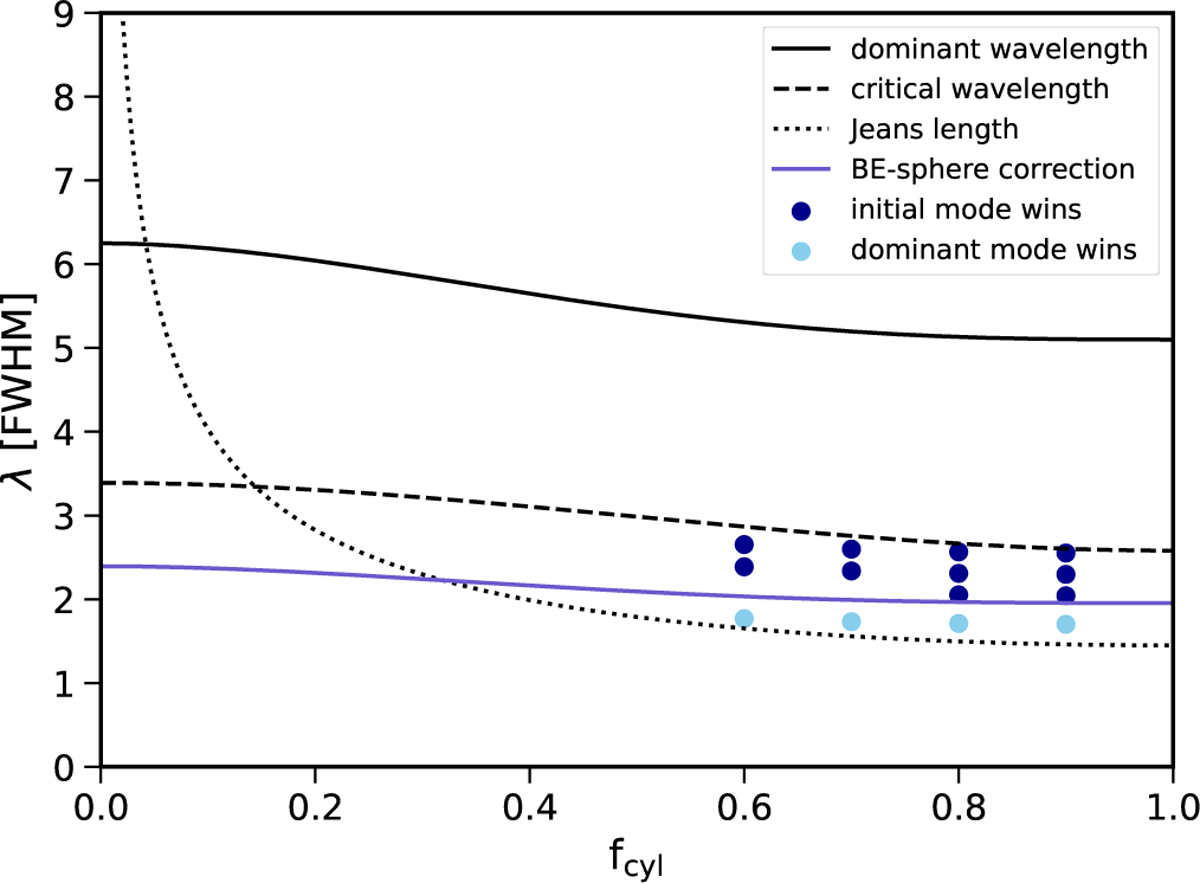
Bonnor-Ebert sphere collapse threshold, shown as the blue solid line, in comparison to the dominant and critical wavelength, given by the black solid and dashed lines, respectively. The wavelengths are given in units of the FWHM of the filament profile. We assess the threshold by performing test simulations indicated by markers where the colour indicates if the initial perturbation is preserved during collapse, given by the dark blue markers, or if it is lost and a collapsing core forms on the dominant wavelength, as shown by the light blue markers.
Current usage metrics show cumulative count of Article Views (full-text article views including HTML views, PDF and ePub downloads, according to the available data) and Abstracts Views on Vision4Press platform.
Data correspond to usage on the plateform after 2015. The current usage metrics is available 48-96 hours after online publication and is updated daily on week days.
Initial download of the metrics may take a while.