Fig. 1
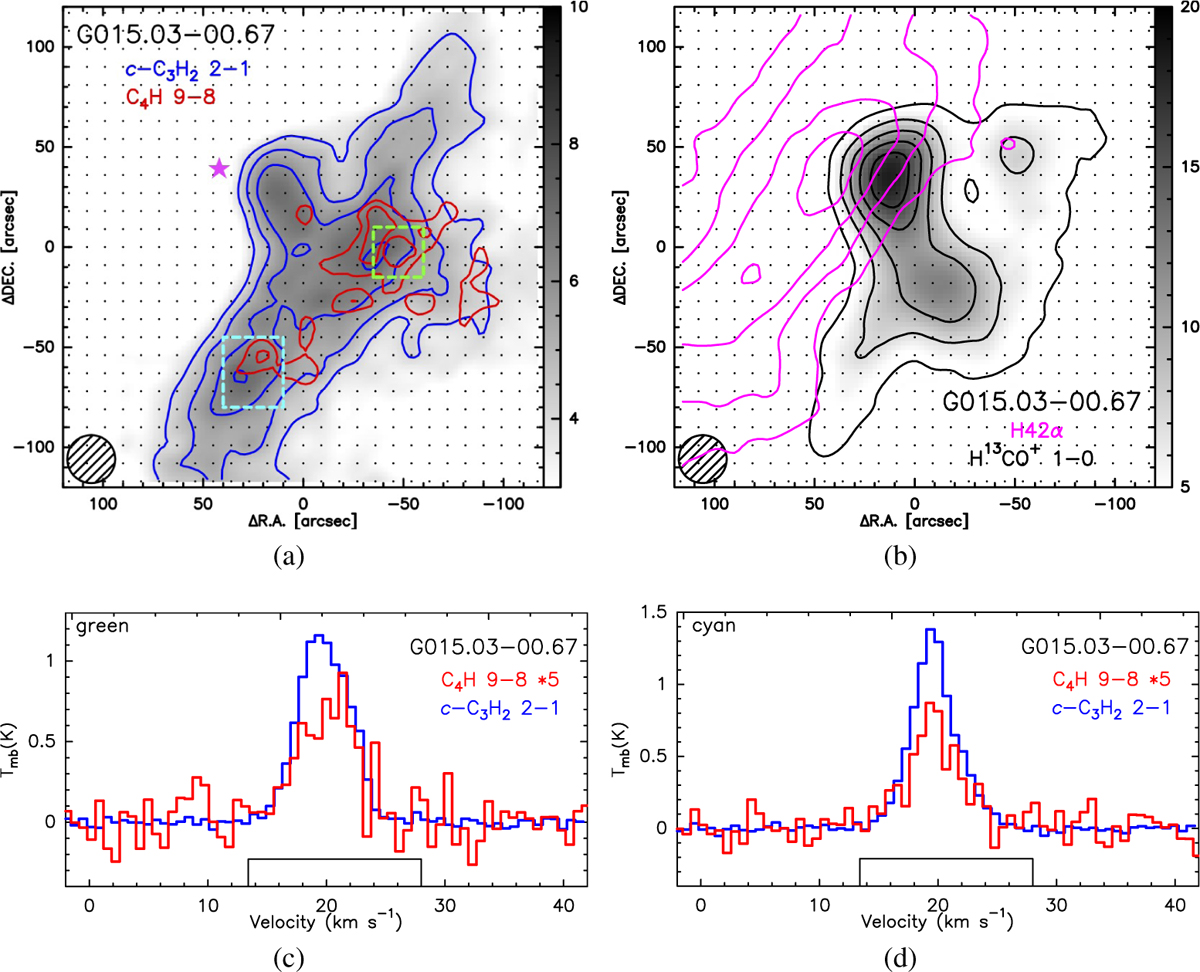
Download original image
Velocity-integrated intensity maps and spatial averaged spectra of C4H 9–8, c-C3H2 2–1, H13CO+ 1–0, and H42α. The source names are presented in the maps and spectra. The grey scale colour at the right is in units of K km s−1. (a and b) Velocity-integrated intensity maps of G015.03–00.67, where panel a shows C4H 9–8 (red contours) overlaid on c-C3H2 2–1 (blue contours and grey scale) and panel b shows H42α (magenta contours) overlaid on H13CO+ 1–0 (black contours and grey scale). The excitation peak of H42α is marked with a magenta five-pointed star in panel a–d Spectra of C4H at 85 672.5793 MHz and c-C3H2 at 85 338.8940 MHz in the green and cyan box of G015.03-00.67. The detailed mapping information of all sources for C4H 9–8, c-C3H2 2–1 and H13CO+ 1–0 are listed in Table B.3.
Current usage metrics show cumulative count of Article Views (full-text article views including HTML views, PDF and ePub downloads, according to the available data) and Abstracts Views on Vision4Press platform.
Data correspond to usage on the plateform after 2015. The current usage metrics is available 48-96 hours after online publication and is updated daily on week days.
Initial download of the metrics may take a while.