| Issue |
A&A
Volume 708, April 2026
|
|
|---|---|---|
| Article Number | A254 | |
| Number of page(s) | 16 | |
| Section | Interstellar and circumstellar matter | |
| DOI | https://doi.org/10.1051/0004-6361/202659367 | |
| Published online | 13 April 2026 | |
The evolution of C4H and c-C3H2 in molecular cores
1
Guangxi Key Laboratory for Relativistic Astrophysics, School of Physical Science and Technology, Guangxi University,
Nanning
530004,
PR China
2
Department of Physics, Anhui Normal University, Wuhu,
Anhui
241002,
PR China
3
Research Center for Computational Earth and Space Science, Zhejiang Laboratory,
Hangzhou
311100,
PR China
4
Department of Physics, Xi’an Jiaotong-Liverpool University,
111 Ren’ai Road, Dushu Lake Science and Education Innovation District,
Suzhou
215123, Jiangsu Province,
PR China
5
State Key Laboratory of Radio Astronomy and Technology, Shanghai Astronomical Observatory, Chinese Academy of Sciences,
80 Nandan Road,
Shanghai
200030,
China
6
Department of Astronomy, School of Physics and Astronomy, and Shanghai Key Laboratory for Particle Physics and Cosmology, Shanghai Jiao Tong University,
Shanghai
200240,
PR China
7
State Key Laboratory of Dark Matter Physics, Shanghai Jiao Tong University,
Shanghai
200240,
PR China
8
National Astronomical Observatories, Chinese Academy of Sciences,
Beijing
100101,
PR China
9
Korea Astronomy and Space Science Institute,
No. 776, Daedeok-daero, Yuseong-gu,
Daejeon,
Republic of Korea
10
I. Physikalisches Institut, Universität zu Köln,
Zülpicher Str. 77,
50937
Köln,
Germany
11
School of Astronomy and Space Sciences, University of Chinese Academy of Sciences,
No. 19A Yuquan Road,
Beijing
100049,
PR China
★ Corresponding author: This email address is being protected from spambots. You need JavaScript enabled to view it.
Received:
7
February
2026
Accepted:
2
March
2026
Abstract
Context. Linear C4H and cyclic c-C3H2, as small unsaturated hydrocarbons, are the key precursors to complex organic molecules and are critical components of the interstellar medium. However, observational constraints on the evolution of these molecules in late-stage massive star-forming regions remain scarce.
Aims. We present on-the-fly mapping observations of C4H 9–8 lines, c-C3H2 2–1, H13CO+ 1–0, and H42α toward a sample of 22 massive star-forming regions using the IRAM 30 m telescope. Our aim is to further explore the evolution of these carbon-chain molecules by combining observational results obtained in cold cores.
Methods. We employed H13CO+ 1–0 and H42α as tracers to probe the positions of molecular cloud cores and ionised hydrogen regions (H II regions), respectively. One chemical model in particular, which includes gas, dust grain surface, and icy mantle phases for C4H and c-C3H2 molecules, was used to make comparisons with observed abundances.
Results. From mapping observations targeting 31 regions across 22 sources, C4H 9–8 (J = 19/2–17/2) and C4H 9–8 (J = 17/2–15/2) were detected in only 17 regions, while H13CO+ 1–0 and c-C3H2 2–1 were successfully detected in all 31 regions. We find that the emission of C4H 9–8 and c-C3H2 2–1 is concentrated at the edges of H42α emission regions. The C4H/H13CO+ and c-C3H2/H13CO+ relative abundance ratios range from 0.17 to 1.77 (median ~0.57) and 1.42 to 6.69 (median ~4.19), respectively, with a median C4H/c-C3H2 ratio of 0.13. By combining the observational results of cold cores, we find that C4H/H13CO+ and c-C3H2/H13CO+ ratios show a strong decreasing trend as molecular cores evolve.
Conclusions. The decreasing trends in C4H/H13CO+ and c-C3H2/H13CO+ ratios imply that small unsaturated hydrocarbons can be consumed and converted into other organic molecules during the evolution of molecular cores. The spatial concentration of C4H and c-C3H2 emission at the edges of H42α regions further supports their role as precursors in the chemical pathways that lead to complex organic molecules in the interstellar medium.
Key words: ISM: abundances / ISM: clouds / evolution / ISM: molecules
© The Authors 2026
 Open Access article, published by EDP Sciences, under the terms of the Creative Commons Attribution License (https://creativecommons.org/licenses/by/4.0), which permits unrestricted use, distribution, and reproduction in any medium, provided the original work is properly cited.
This article is published in open access under the Subscribe to Open model. This email address is being protected from spambots. You need JavaScript enabled to view it. to support open access publication.
1 Introduction
The interstellar medium harbours a rich diversity of carbon-bearing molecules. Among these, unsaturated hydrocarbon molecules play a pivotal role in tracing chemical evolution, with small unsaturated hydrocarbons such as C4H and c-C3H2 serving as crucial fundamental building blocks for the formation of more complex organic molecules. The evolution of unsaturated organic molecules in molecular clouds is critically important, as it represents a crucial stellar feedback mechanism that provides essential constraints for understanding star formation processes (Awad & Viti 2022). Regarding C4H and c-C3H2, strong emission has been detected in TMC-1 (Irvine et al. 1981; Thaddeus et al. 1985; Madden et al. 1989), the starless core L1521F (Harada & Herbst 2008; Takakuwa et al. 2011), and the cold molecular cores (Liu et al. 2024), where their relative abundances are relatively high. However, studies examining the evolution of carbon-chain molecules in massive star-forming regions are still relatively limited.
C4H, a prototypical linear carbon chain molecule, is predominantly formed via gas-phase processes and exists primarily as a gas-phase species. Drawing on several astrochemical networks, C4H can be formed by some routes for the CnH family and through C + C3H2 → C4H + H (Loison et al. 2014; Remijan et al. 2023). The destruction of C4H is dominated by the reaction with oxygen, C4H + O → CO + C3H (Loison et al. 2014), and through the radiative association of an electron, a process that disrupts its molecular structure and forms C4H− (Harada & Herbst 2008; Gianturco et al. 2016). The cyclic isomer c-C3H2 is observed to be comparatively abundant relative to its linear counterparts l-C3H2 within the interstellar medium. It forms in the gas phase via dissociative recombination of ![Mathematical equation: $\[\mathrm{C}_{3} \mathrm{H}_{3}^{+}+\mathrm{e}^{-} \rightarrow c-\mathrm{C}_{3} \mathrm{H}_{2}+\mathrm{H}\]$](/articles/aa/full_html/2026/04/aa59367-26/aa59367-26-eq1.png) ) (Fossé et al. 2001) and isomerisation of l-C3H2 (H + l-C3H2 → H + c-C3H2) (Loison et al. 2017). The primary destruction pathway of c-C3H2 corresponds to the gas-phase reaction with atomic oxygen (O), HC3O, and other oxygen-bearing fragments, while its reaction with C atoms facilitates carbon-chain growth to form molecules such as C4H (Loison et al. 2017). This reaction exhibits high efficiency at low temperatures.
) (Fossé et al. 2001) and isomerisation of l-C3H2 (H + l-C3H2 → H + c-C3H2) (Loison et al. 2017). The primary destruction pathway of c-C3H2 corresponds to the gas-phase reaction with atomic oxygen (O), HC3O, and other oxygen-bearing fragments, while its reaction with C atoms facilitates carbon-chain growth to form molecules such as C4H (Loison et al. 2017). This reaction exhibits high efficiency at low temperatures.
Liu et al. (2024) found distinct spatial distributions of C4H 9–8 and c-C3H2 2–1 across 19 Galactic cold cores in the early stages of star formation. Furthermore, it was found that C4H and c-C3H2 may not have a tight chemical link in cold molecular cores and their abundances relative to H2 are approximately 10−9 (Liu et al. 2024). The abundance of these two unsaturated hydrocarbon molecules (C4H and c-C3H2) is likely to decrease as the molecular cloud evolves. Consistent with this trend, a survey conducted with the Yebes 40-m telescope by Taniguchi et al. (2024) revealed that C4H and c-C3H2 were detected in the majority of 11 intermediate-mass cores, with their abundances being lower than those observed in the low-mass protostar L1527. In a survey of diffuse and marginally translucent clouds toward compact extragalactic millimeter-continuum sources, Lucas & Liszt (2000) also detected the hydrocarbons C4H and c-C3H2 within these extragalactic sources. However, current studies on such unsaturated hydrocarbons in late-stage massive star-forming regions remain scarce. To gain deeper insights into the evolution of C4H and c-C3H2 in star-forming regions at different evolutionary stages, mapping observations in the massive star-forming regions are necessary.
In this paper, we present mapping observations of C4H 9–8 lines, c-C3H2 2–1, H13CO+ 1–0, and H42α toward a relatively large sample of 22 Galactic late-stage massive star-forming regions with known 6.7 GHz CH3OH masers using the Institut de Radioastronomie Millimétrique (IRAM) 30-meter telescope. We investigate the spatial distributions and relative abundances of C4H and c-C3H2 in these regions to better understand the evolution of carbon-chain molecules. The observations and data reduction are described in Sect. 2, and the results in Sect. 3. A discussion is presented in Sect. 4 and a brief summary in Sect. 5.
Physical parameters of C4H, c-C3H2 and H13CO+ lines.
2 Observation and data reduction
The 22 targets, selected from Reid et al. (2014), are late-stage massive star-forming regions with 6.7 GHz CH3OH masers, for which accurate trigonometric parallaxes have been measured. On-the-fly (OTF) mapping observations were carried out using the IRAM 30-meter telescope, located at Pico Veleta, Spain, during July 2019, October 2019, November 2019, December 2020, and January 2021. The observational data were acquired using the Eight Mixer Receiver (EMIR) operating 3 mm (E0) band, coupled with the Fourier Transform Spectrometers (FTS) backend, which provided an instantaneous bandwidth of 8 GHz. The system delivered a spectral resolution of 195 kHz with dual polarisation capability. The IRAM 30 m telescope has a beam size of ~24″ at 85 GHz. A pixel size of 9″ was adopted for regridding of the OTF data. The system temperatures remained stable at approximately 150 K. The telescope pointing accuracy was maintained through regular calibration every ~2 hours using strong nearby quasi-stellar objects as reference points. The focus was calibrated prior to each observation, as well as at sunrise and sunset.
The main beam brightness temperature (Tmb) was derived by ![Mathematical equation: $\[T_{\mathrm{mb}}=T_{\mathrm{A}}^{*} \cdot F_{\text {eff}} / B_{\text {eff}}\]$](/articles/aa/full_html/2026/04/aa59367-26/aa59367-26-eq2.png) , where
, where ![Mathematical equation: $\[T_{\mathrm{A}}^{*}\]$](/articles/aa/full_html/2026/04/aa59367-26/aa59367-26-eq3.png) represents the antenna temperature. For the 3 mm band observations, the forward efficiency, Feff, and beam efficiency, Beff, were 0.95 and 0.81, respectively. The following molecular lines within the observed frequency range were analysed in this study: C4H 9–8 (85.634.0044 MHz, J=19/2–17/2; 85 634.0154 MHz, J=19/2–19/2; 85 672.5793 MHz, J=17/2–15/2; 85 672.5815 MHz, J=17/2–17/2), c-C3H2 2–1 (85 338.8940 MHz), H13CO+ 1–0 (86 754.2884 MHz), and H42α at 85 688.4 MHz. Owing to significant line blending, C4H 9–8 (J = 19/2–17/2) and C4H 9–8 (J = 19/2–19/2) are treated as a single feature and denoted as C4H 9–8 (J = 19/2–17/2) in this work. An analogous approach was applied to the C4H 9–8 (J = 17/2–15/2) and C4H 9–8 (J = 17/2–17/2) transitions. The parameters for the molecular lines were extracted from the Cologne Database for Molecular Spectroscopy (CDMS1; Müller et al. 2005) and summarised in Table 1.
represents the antenna temperature. For the 3 mm band observations, the forward efficiency, Feff, and beam efficiency, Beff, were 0.95 and 0.81, respectively. The following molecular lines within the observed frequency range were analysed in this study: C4H 9–8 (85.634.0044 MHz, J=19/2–17/2; 85 634.0154 MHz, J=19/2–19/2; 85 672.5793 MHz, J=17/2–15/2; 85 672.5815 MHz, J=17/2–17/2), c-C3H2 2–1 (85 338.8940 MHz), H13CO+ 1–0 (86 754.2884 MHz), and H42α at 85 688.4 MHz. Owing to significant line blending, C4H 9–8 (J = 19/2–17/2) and C4H 9–8 (J = 19/2–19/2) are treated as a single feature and denoted as C4H 9–8 (J = 19/2–17/2) in this work. An analogous approach was applied to the C4H 9–8 (J = 17/2–15/2) and C4H 9–8 (J = 17/2–17/2) transitions. The parameters for the molecular lines were extracted from the Cologne Database for Molecular Spectroscopy (CDMS1; Müller et al. 2005) and summarised in Table 1.
The data reduction was performed using the GILDAS software package2, specifically employing the CLASS and GREG applications. For each molecular line detected in the observed sources, we first determined the velocity range of the spectral emission features. Following the removal of a first-order baseline, these velocity ranges were utilised as a mask and setup window within the CLASS software. The spatial distribution of each line was obtained by applying the print area function in CLASS to extract velocity-integrated flux maps at each spatial pixel. The observational parameters for all sources are presented in Table B.1.
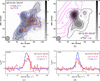 |
Fig. 1 Velocity-integrated intensity maps and spatial averaged spectra of C4H 9–8, c-C3H2 2–1, H13CO+ 1–0, and H42α. The source names are presented in the maps and spectra. The grey scale colour at the right is in units of K km s−1. (a and b) Velocity-integrated intensity maps of G015.03–00.67, where panel a shows C4H 9–8 (red contours) overlaid on c-C3H2 2–1 (blue contours and grey scale) and panel b shows H42α (magenta contours) overlaid on H13CO+ 1–0 (black contours and grey scale). The excitation peak of H42α is marked with a magenta five-pointed star in panel a–d Spectra of C4H at 85 672.5793 MHz and c-C3H2 at 85 338.8940 MHz in the green and cyan box of G015.03-00.67. The detailed mapping information of all sources for C4H 9–8, c-C3H2 2–1 and H13CO+ 1–0 are listed in Table B.3. |
3 Results
From the mapping observations, multiple emission peaks were detected in several sources. Thus, a total of 31 regions were selected across 22 sources. C4H (9–8, J = 19/2–17/2) and C4H (9–8, J = 17/2–15/2) were detected in only 17 regions, while H13CO+ (1–0) and c-C3H2 (2–1) were successfully detected in all 31 regions. The detailed detection results of these molecular lines are summarised in Table B.2.
3.1 Spatial distribution of C4H, c-C3H2, and H13CO+ lines
Given the relatively weak individual signals of C4H 9–8 (J=19/2–17/2) and C4H 9–8 (J=17/2–15/2), and considering their nearly identical Einstein coefficients and upper energy levels, it is reasonable to combine them into a single total velocity-integrated intensity. This approach provides a more reliable representation of the spatial distribution of C4H compared to analyzing each line independently. Hereafter, C4H 9–8 is used to represent the total velocity-integrated fluxes of C4H 9–8 (J=19/2–17/2) and C4H 9–8 (J=17/2–15/2).
To better demonstrate the spatial distribution of these molecular lines, two velocity-integrated intensity maps were drawn for each source. An example of the G015.03–00.67 source is shown in Fig. 1, the velocity-integrated intensity distributions of C4H 9–8 (red contours) and c-C3H2 2–1 (blue contours and grey scale) are presented in Fig. 1a, while the spatial distributions of H13CO+ 1–0 (black contours and grey scale) and H42α (magenta contours) are illustrated in Fig. 1b. The remaining spatial distribution maps are illustrated in Appendix A.1 and the parameter settings for the maps of molecular emission lines in each source are summarised in Table B.3.
Among the eight sources for which spatial distribution maps of C4H 9–8 were obtained, six sources exhibited clear and well-defined spatial structures. However, due to limitations in sensitivity and spatial resolution, the maps of C4H 9–8 could not be resolved in the sources G034.39+00.22 and G075.76+00.33. In all sources where the c-C3H2 2–1 (22 sources), H13CO+ 1–0 (22 sources), and H42α (9 sources) were detected, we identified significant and well-resolved spatial distribution structures. The detailed spatial distribution information of C4H 9–8, c-C3H2 2–1, H13CO+ 1–0, and H42α lines is presented in Table B.4.
Six of the eight sources detected in C4H 9–8 exhibit spatial distribution structures that differ significantly from those of c-C3H2 2–1 and H13CO+ 1–0. Despite the fact that the emission of C4H 9–8 is relatively weak in both G034.39+00.22 and G075.76+00.33, the emission peaks are not found to be significantly different from c-C3H2 2–1 and H13CO+ 1–0. Furthermore, H42α was detected in four of these eight sources, with the spatial structures of three sources exhibiting significant differences, except for G075.76+00.33.
In 14 of the 22 sources where c-C3H2 2–1 was detected (G005.88–00.39, G011.91–00.61, G015.03–00.67, G023.43–00.18, G031.28+00.66, G034.39+00.22, G035.19–00.74, G035.19–01.74, G037.43+01.51, G075.76+00.33, G081.19+01.51, G081.75+00.59, G081.87+00.78, and G121.29+00.65), the spatial distribution of c-C3H2 2–1 was not found to different from that of H13CO+ 1–0. In contrast, the remaining eight sources (G012.80–00.20, G043.16+00.01, G049.48–00.36, G049.48–00.38, G109.87+02.11, G111.54+00.77, G133.94+01.06, and G192.60–00.04) exhibited significantly different spatial structures between c-C3H2 2–1 and H13CO+ 1–0. In the sources G012.80–00.20, G043.16+00.01, G049.48–00.36, G049.48–00.38, and G109.87+02.11, the spatial distribution differences between c-C3H2 2–1 and H13CO+ 1–0 are primarily characterised by the significantly weaker emission of c-C3H2 2–1 at the peak excitation regions of H13CO+ 1–0. This observed discrepancy suggests that c-C3H2 2–1 may have been depleted or consumed during the process of stellar evolution in these regions, while all nine sources in which H42α was detected with c-C3H2 2–1 showed a clearly different spatial distribution. The individual sources providing useful spatial information are annotated below.
G015.03-00.67: the mapping size of C4H 9–8, c-C3H2 2–1, H13CO+ 1–0, and H42α is 240″ × 240″. Strong emissions of C4H 9–8, c-C3H2 2–1, H13CO+ 1–0, and H42α were detected, each exhibiting a distinct and well-resolved spatial structure. The emission peaks of c-C3H2 2–1 and H13CO+ 1–0 locate at approximately (10″, 40″) of the map, with no significant spatial differences. Both transitions display an extended spatial distribution, covering a region of about 180″ × 240″, and they are primarily concentrated along the edges of the H42α emission. In contrast, the C4H 9–8 emission is fragmented and lies primarily along the eastern edge of c-C3H2 2–1 region. Meanwhile, the H42α emission forms a band-like structure predominantly along the south-eastern part of the source G015.03-00.67. Its emission peak lies near (45″, 40″), slightly offset from those of c-C3H2 2–1 and H13CO+ 1–0.
G023.43-00.18: the OTF mode was used to cover 120″ × 120″ for C4H 9–8, c-C3H2 2–1, H13CO+ 1–0, and H42α. All these lines, except for H42α, were successfully detected. C4H 9–8 and c-C3H2 2–1 exhibit different spatial distributions. The C4H 9–8 emission is primarily concentrated at south of the c-C3H2 2–1, with a slight offset between their peak positions, approximately centered at (−10″, 10″) and (0″, −10″), respectively. In contrast, no significant spatial differences were observed between the distributions of c-C3H2 2–1, and H13CO+ 1–0.
G049.48-00.36: a 120″ × 120″ map of C4H 9–8, c-C3H2 2–1, H13CO+ 1–0, and H42α was obtained. Although all lines were detected, C4H 9–8 and c-C3H2 2–1 exhibit markedly different spatial distributions, with partial overlap observed in the south-western region of c-C3H2 2–1 emission. c-C3H2 2–1 emission extends across nearly the entire source, displaying two prominent peaks at approximately (40″, −20″) and (−40″, −10″). In comparison, C4H 9–8 is primarily distributed in the southern and south-western parts of G049.48-00.36, with its peak around (−35″, −15″), closely coincides with one of the peak positions of c-C3H2 2–1. Meanwhile, the H42α emission is localised to the south-eastern region of G049.48-00.36, exhibiting two prominent excitation peaks at (0″, 0″) and (30″, −30″).
G049.48-00.38: the mapping size of C4H 9–8, c-C3H2 2–1, H13CO+ 1–0, and H42α is 120″ × 120″. The source is located adjacent to G049.48-00.36. All the lines were detected, though with varying characteristics. The weak C4H 9–8 emission presents spatially unresolved due to sensitivity and spatial resolution limitations, with only a marginal detection in the south-eastern region of G049.48-00.38. In contrast, the strong c-C3H2 2–1, H13CO+ 1–0, and H42α emission were clearly observed, extending from the north-west to the south-east across the source.
G081.75+00.59: in this study, we divided the source G081.75+00.59 into two parts, designated as G081.75+00.59-1 and G081.75+00.59-2, with a detailed analysis of each provided separately. For both parts, the observational sizes of C4H 9–8, c-C3H2 2–1, H13CO+ 1–0, and H42α are 120″ × 120″ and 80″ × 80″, respectively. In this source, all the molecular lines were detected, except H42α. They exhibit extended filamentary structures spanning more than 120″, revealing distinct and resolved spatial distributions.
G192.60-00.04: the mapping size of C4H 9–8, c-C3H2 2–1, H13CO+ 1–0, and H42α is 120″ × 240″. All targeted lines have been detected, revealing distinct spatial distributions, except for H42α. H13CO+ 1–0 emission extends from the north-west to the south-east over a region exceeding 200″, with its peak located at (−15″, 40″). In contrast, the spatial distribution of C4H 9–8 consists of two distinct components: one component is slightly offset from the emission center of c-C3H2 2–1, peaking at (−10″, 30″), while the other lies at (−30″, −60″) near the south-western edge of c-C3H2 2–1 emission.
3.2 Column densities and relative abundances
Based on the spatial distributions of C4H 9–8, c-C3H2 2–1, and H13CO+ 1–0 in Sect. 3.1, we selected the regions with the strongest emission from each source. Since multiple emission peaks were detected in several sources, a total of 31 distinct regions were selected from 22 sources to calculate the column densities and relative abundances of the three molecules. The regions for extracting the spatially averaged spectra are marked with green dashed boxes. For maps with multiple selected regions, the second region is highlighted with a cyan box for clear distinction. The velocity-integrated intensities of these three lines were derived from the spatially averaged spectra via single-component Gaussian fitting. G049.48–00.36 and its adjacent counterpart G049.48–00.38 are both complex regions and major massive protocluster candidates in W51 (Ginsburg et al. 2012). Due to the absorption of molecular lines toward free-free continuum emission, we selected regions away from H42α when calculating abundances.
Next, c-C3H2 2–1 and H13CO+ 1–0 emissions were detected in all 31 selected regions. Among these, C4H 9–8 transitions (including J=19/2–17/2 and J=17/2–15/2) were detected in 17 regions, specifically: G015.03-00.67 (green and cyan), G023.43-00.18 (green), G034.39+00.22 (green), G049.48–00.36 (green and cyan), G049.48–00.38 (green and cyan), G075.76+00.33 (green), G081.75+00.59-1 (green and cyan), G081.75+00.59-2 (green and cyan), G081.87+00.78 (green), G133.94+01.06 (green), and G192.60-00.04 (green and cyan). The spectroscopic properties of these detections are summarised in Table B.5, which includes source names, molecular line names, velocity-integrated intensities (∫Tmb dv), full-width at half-maximum (FWHM), and peak temperatures (Tpeak) for all 31 regions. The velocity-integrated intensities of C4H 9–8 transitions J=19/2–17/2 and J=17/2–15/2, exhibit a range of 0.11 ± 0.03 K km s−1 in G081.87+00.78 (green) to 1.25 ± 0.12 in G049.48–00.38 (cyan) and 0.13 ± 0.04 K km s−1 in G081.87+00.78 (green) to 1.33 ± 0.10 K km s−1 in G049.48–00.38 (cyan), respectively. By contrast, the c-C3H2 2–1 were detected in G015.03-00.67 (green) with the strongest velocity-integrated fluxes of 6.42 ± 0.06 K km s−1, while the weakest emissions were found to be 0.98 ± 0.06 K km s−1 in G188.94+00.88 (green).
Under the assumptions of local thermodynamic equilibrium (LTE) and optical thinness, the column density of these molecules can be calculated using the following formula,
![Mathematical equation: $\[N_{\mathrm{tot}}=\frac{8 \pi k v^2}{h c^3 A_{u l}} \frac{Q\left(T_{\mathrm{ex}}\right)}{\mathrm{g}_{\mathrm{u}}} e^{E_u / k T_{\mathrm{ex}}} \int T_{\mathrm{mb}} \mathrm{dv}\left(\mathrm{~cm}^{-2}\right).\]$](/articles/aa/full_html/2026/04/aa59367-26/aa59367-26-eq4.png) (1)
(1)
In the above equation, k represents the Boltzmann constant, v is the frequency of the molecular emission line, h is the Planck constant, c is the speed of light, Aul is the Einstein emission coefficient, gu is the upper-level degeneracy, and Eu is the upper-level energy. The values for ν, gu, Aul, and Eu corresponding to the C4H 9–8 (J=19/2–17/2), C4H 9–8 (J=19/2–19/2), C4H 9–8 (J=17/2–15/2), C4H 9–8 (J=17/2–17/2), c-C3H2 2–1, and H13CO+ 1–0 are shown in Table 1, which are taken from the CDMS database. The partition function Q(Tex) predominantly depends on the excitation temperature Tex. In this study a value of 37.5 K was adopted for Tex, as all the sources were selected from hot cores.
The small difference in frequency between C4H 9–8 (J=19/2–17/2) and C4H 9–8 (J=19/2–19/2), as well as between C4H 9–8 (J=17/2–15/2) and C4H 9–8 (J=17/2–17/2) results in a blending of the lines, where only two emission features are observable across these four transitions. Therefore, based on Eq. (1), and considering the two blended lines with their respective values for Aul1, gu1 and Aul2, gu2, the following equation can be derived to calculate the column density of C4H,
![Mathematical equation: $\[N_{\mathrm{tot}}=\frac{8 \pi k \nu^2}{h c^3} \frac{Q\left(T_{\mathrm{ex}}\right)}{A_{u l_1} \mathrm{~g}_{\mathrm{u}_1}+\mathrm{A}_{\mathrm{ul}_2} \mathrm{~g}_{\mathrm{u}_2}} e^{E_u / k T_{\mathrm{ex}}} \int T_{\mathrm{mb}} \mathrm{dv}(\mathrm{cm}^{-2}).\]$](/articles/aa/full_html/2026/04/aa59367-26/aa59367-26-eq5.png) (2)
(2)
Since the difference in Eu between the two blended molecular lines is also very small, we use the Eu values of C4H 9–8 (J=19/2–17/2) and C4H 9–8 (J=17/2–15/2) in Eq. (2). For sources with non-detection of C4H 9–8 emission, 3σ upper limits for the integrated intensity, ∫Tmb dv, were calculated using the formula ![Mathematical equation: $\[3 \times \operatorname{rms} \sqrt{\delta v \cdot \Delta v}\]$](/articles/aa/full_html/2026/04/aa59367-26/aa59367-26-eq6.png) , where δv is the channel separation in velocity, Δv is the velocity range for integration in km s−1, and rms is the root mean square value per channel of the spectrum.
, where δv is the channel separation in velocity, Δv is the velocity range for integration in km s−1, and rms is the root mean square value per channel of the spectrum.
The column densities of C4H, c-C3H2, and H13CO+ are displayed in columns 2–4 of Table B.7. The range of column densities for C4H spans from 0.33 × 1013 cm−2 in G081.87+00.78 (green) to 3.67 × 1013 cm−2 in G049.48-00.38 (cyan), c-C3H2 range from 2.68 × 1013 cm−2 in G188.94+00.88 (green) to 17.57 × 1013 cm−2 in G015.03-00.67 (green), and H13CO+ from 0.48 × 1013 cm−2 in G192.60-00.04 (cyan) to 4.92 × 1013 cm−2 in G049.48-00.36 (green).
The relative abundances of the three molecules, which can be derived from the averaged column densities for each core, are more important than the averaged densities for the scientific analysis in this study. Table B.7 exhibits the abundance ratios [C4H/H13CO+], [c-C3H2/H13CO+], and [C4H/c-C3H2] in these 26 regions. The abundance ratio of [C4H/H13CO+] ranges from 0.17 ± 0.04 in G081.87+00.78 (green) to 1.77 ± 0.11 in G049.48-00.38 (cyan), with a median value of 0.57, while it ranges from 1.42 ± 0.05 in G081.87+00.78 (green) to 6.69 ± 0.34 in G192.60-00.04 (cyan) with a median value of 4.19 for [c-C3H2/H13CO+]. For the ratio [C4H/c-C3H2], the values range from 0.07 ± 0.01 in G081.75+00.59 (green) to 0.29 ± 0.03 in G133.94+01.06 (green), with a median value of 0.13. By combining data from 25 regions selected from 19 cold cores in a previous work (Liu et al. 2024) with current data from 26 regions of 22 hot cores, we obtained the relation between the abundances of C4H and c-C3H2 normalised by H13CO+. It is shown in Fig. 2, with a Pearson correlation coefficient of 0.83, a slope of 3.41, and a least-squares fitting.
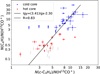 |
Fig. 2 Relation between c-C3H2/H13CO+ and C4H/H13CO+ abundance ratios. Data are from 31 regions in 22 hot cores (red points) and 22 regions in 19 cold cores (blue points). |
4 Discussion
4.1 Relative abundances of C4H and c-C3H2 from cold and hot cores
As shown in Fig. 2, the abundance ratios of C4H and c-C3H2 relative to H13CO+ decreases from cold cores (Liu et al. 2024) to hot cores, suggesting a downward trend with advancing evolutionary stage of star formation. A least-squares fitting procedure results in the relation: lg(C4H/H13CO+) = 3.41lg(c-C3H2/H13CO+) - 3.20, with a correlation coefficient of 0.83 (excluding C4H upper limits). Among these 31 hot regions, column densities of both c-C3H2 and H13CO+ were successfully obtained, while C4H was acquired for 18 regions. Specifically, C4H/H13CO+ ratio ranges from 0.17 to 1.77 (median ~0.57), and c-C3H2/H13CO+ ratio spans 1.42 to 6.69 (median ~4.19) in hot cores, whereas cold cores exhibit significantly higher ratios of C4H/H13CO+ (3–50) and c-C3H2/H13CO+ ratios (2–18) (Liu et al. 2024). This observational trend may be closely related to the low temperatures (10–20 K) that are characteristic of cold molecular cores. Given that these cloud cores typically form during the early phases of interstellar material accretion, their chemical evolution has not yet been significantly disrupted by star-forming activity (Aikawa et al. 2001; Sakai & Yamamoto 2013). Under such low-temperature conditions, the formation pathways of unsaturated hydrocarbons (C4H and c-C3H2) gain a competitive advantage. The low-temperature environment favors simpler reaction mechanisms, particularly because reduced molecular collision rates allow such species to accumulate and sustain relatively high abundances within cold molecular cores (Loison et al. 2017). In contrast, massive star-forming regions exhibit higher temperatures (typically 30–100 K), where star formation activity is more mature. Under these conditions, intense radiation and physical conditions significantly alter the chemical environment of the molecular clouds. The high-temperature conditions may be expected to accelerate the consumption or conversion of these originally stable small molecules into more complex organic species, leading to reduced abundances of C4H and c-C3H2 (Herbst & van Dishoeck 2009; Rodgers & Charnley 2003), which is also consistent with our observational results.
Additionally, it has been established that C4H forms efficiently via gas-phase ion–molecule reactions, a process particularly effective at low temperatures during the early stages of star formation (Herbst & Osamura 2008). Fontani et al. (2025) investigated three sources at different evolutionary stages and found that both C4H and c-C3H2 exhibit higher abundances in the earlier phases. It was concluded that C4H is also formed through the reaction of C2H2 with C2, a process which was found to be more efficient at lower temperatures (Canosa et al. 2007). During the late stages of star formation, thermal processing leads to the desorption of molecules such as H2O, CH3OH, and O2 from dust-grain ice mantles into the gas phase, where C4H is rapidly consumed through reactions with these species (Herbst & Osamura 2008). The derived spatial distribution shows that the emission of C4H 9–8 and c-C3H2 2–1 is relatively weak across most regions near the excitation peak of H42α. In sources such as G015.03-00.67, G049.48-00.36, G049.48-00.38, G075.76+00.33, and G035.19-01.73, the emission is primarily concentrated at the edge of H42α. Additionally, in regions such as G012.80-00.20 and G043.16+00.01, C4H 9–8 was not detected where the emission of H13CO+ 1–0 was strong. These positions exhibited c-C3H2/H13CO+ abundance ratios of 2.17 ± 0.14 and 2.05 ± 0.25, respectively. This finding suggests that unsaturated molecules such as C4H and c-C3H2 can be destroyed or processed into more complex organic molecules during the evolution of molecular cloud cores, leading to a corresponding decrease in their abundances.
4.2 Chemical models
We employed the NAUTILUS three-phase chemical model (Ruaud et al. 2016; Wakelam et al. 2024), which includes gas-phase, grain-surface, and grain-mantle chemistry, to simulate the chemical evolution of c-C3H2 and C4H in both cold-core and hot-core environments. For the cold-core model, typical static physical conditions are adopted. The total hydrogen nuclei density is set to nH = 104 cm−3, the temperature is fixed at T = 10 K, and the cosmic-ray ionisation rate is taken to be ζ = 1.3×10⁻¹⁷ s−1. The hot-core physical model is divided into two successive stages: a free-fall collapse stage followed by a warmup stage. During the collapse stage, the temperature remains constant at T = 10 K, while the density increases from 3 × 10³ to 3 × 106 cm−3. In the warm-up stage, the density is kept constant, and the temperature gradually increases up to 100 K.
The optically thin H13CO+ 1–0 isotopologue line was employed to normalise the relative abundances of c-C3H2 and C4H relative to H13CO+ from their observed intensities. Figure 3 shows the abundances of c-C3H2, C4H, and HCO+, as the major isotopic molecule of H13CO+, predicted by the models. The shaded regions indicate the observational abundance ranges of the corresponding species. Observations show that the abundance of C4H and HCO+ in cold cores is approximately two orders of magnitude higher than that in hot cores, while the abundance of c-C3H2 in cold cores is about one order of magnitude higher than that in hot cores. Figures 4 and 5 show the net percentage contributions of the formation and destruction pathways of c-C3H2 and C4H, respectively, in cold and hot cores. Because the chemistry of these species involves a large number of reactions (e.g. more than 100 reactions for C4H), only reaction pathways with contributions greater than 5% are shown in the figures. Reaction pathways for which the products are not explicitly labeled correspond to reactions with multiple product branching channels. Each panel shows the net percentage contributions of the formation or destruction pathways on the left-hand y-axis, while the abundances of c-C3H2 or C4H are indicated on the right-hand y-axis.
According to the model results, in cold cores, c-C3H2 is mainly formed via the dissociative recombination of ![Mathematical equation: $\[\mathrm{C}_3 \mathrm{H}_3^{+}\]$](/articles/aa/full_html/2026/04/aa59367-26/aa59367-26-eq7.png) with e−, while C4H is primarily produced through the dissociative recombination of
with e−, while C4H is primarily produced through the dissociative recombination of ![Mathematical equation: $\[\mathrm{C}_4 \mathrm{H}_2^{+}\]$](/articles/aa/full_html/2026/04/aa59367-26/aa59367-26-eq8.png) with e−. During the collapse stage of the hot-core model, the formation pathways of c-C3H2 and C4H are nearly identical to those in cold cores. However, as the density increases, both species are almost completely depleted toward the end of the collapse phase, with abundances falling below 10−12. In the subsequent warm-up stage, c-C3H2 and C4H are gradually reformed. Their formation pathways become more complex and differ significantly from those in cold cores. Meanwhile, the increasing temperature enhances their destruction efficiencies, which ultimately leads to lower abundances of both species in hot cores compared to cold cores. During the warm-up stage, c-C3H2 is mainly formed through the dissociative recombination of
with e−. During the collapse stage of the hot-core model, the formation pathways of c-C3H2 and C4H are nearly identical to those in cold cores. However, as the density increases, both species are almost completely depleted toward the end of the collapse phase, with abundances falling below 10−12. In the subsequent warm-up stage, c-C3H2 and C4H are gradually reformed. Their formation pathways become more complex and differ significantly from those in cold cores. Meanwhile, the increasing temperature enhances their destruction efficiencies, which ultimately leads to lower abundances of both species in hot cores compared to cold cores. During the warm-up stage, c-C3H2 is mainly formed through the dissociative recombination of ![Mathematical equation: $\[\mathrm{C}_{3} \mathrm{H}_{5}^{+}\]$](/articles/aa/full_html/2026/04/aa59367-26/aa59367-26-eq9.png) with e−, with an additional contribution from the dissociative recombination of
with e−, with an additional contribution from the dissociative recombination of ![Mathematical equation: $\[\mathrm{C}_3 \mathrm{H}_3^{+}\]$](/articles/aa/full_html/2026/04/aa59367-26/aa59367-26-eq10.png) . For C4H, the dominant formation pathways include reactions involving HC5 NH+ with e−, as well as thermal desorption from grain surfaces as the temperature increases.
. For C4H, the dominant formation pathways include reactions involving HC5 NH+ with e−, as well as thermal desorption from grain surfaces as the temperature increases.
In both cold-core and hot-core environments, the destruction of c-C3H2 and C4H is dominated by neutral–neutral reactions. In cold cores, however, the low temperatures significantly reduce the efficiency of neutral–neutral destruction pathways. As a result, the destruction rates are lower than the formation rates driven by dissociative recombination, allowing the abundances of c-C3H2 and C4H to accumulate and reach higher levels than in hot cores.
In hot cores, the increasing gas density during the collapse stage and the rising temperature during the warm-up stage both enhance neutral–neutral destruction reactions. Consequently, the destruction of c-C3H2 and C4H becomes more efficient, leading to lower abundances of these species compared to those in cold cores.
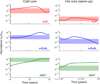 |
Fig. 3 Temporal evolution of c-C3H2, C4H, and HCO+ abundances predicted by models in cold core and hot core (warm-up). |
5 Summary and conclusions
We observed C4H 9–8 lines, c-C3H2 2–1, H13CO+ 1–0, and H42α toward 22 late-stage massive star-forming regions with the IRAM 30 m telescope. Column densities and abundance ratios were derived under local thermodynamic equilibrium, combined with data from 19 cold cores to explore evolutionary trends.
C4H 9–8 lines were detected in 17 regions, specifically: G015.03–00.67 (green and cyan), G023.43–00.18 (green), G034.39+00.22 (green), G049.48–00.36 (green and cyan), G049.48–00.38 (green and cyan), G075.76+00.33 (green), G081.75+00.59-1 (green and cyan), G081.75+00.59-2 (green and cyan), G081.87+00.78 (green), G133.94+01.06 (green), and G192.60–00.04 (green and cyan), out of 31 regions toward 22 sources, while c-C3H2 2–1 and H13CO+ 1–0 were detected in all regions. Both carbon-chain molecules are spatially concentrated at the edges of H42α emission regions, avoiding harsh H II region core environments. The abundance ratios in late-stage regions are: C4H/H13CO+ (0.170–1.77, median ~0.57), c-C3H2/H13CO+ (1.42–6.69), median ~4.19), and C4H/c-C3H2 (0.07–0.29, median ~0.13), all significantly lower than in cold cores.
NAUTILUS three-phase model simulations confirm this evolutionary trend, predicting higher abundances in cold cores by one to two orders of magnitude than in hot cores. Formation mechanisms shift from dissociative recombination (cold cores) to gas-phase reactions and grain desorption (late-stage regions), with destruction enhanced by neutral–neutral reactions in high-temperature and high-density environments.
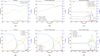 |
Fig. 4 Net percentage contributions of the formation and destruction pathways of c-C3H2 in cold and hot cores. (a) Net percentage contributions of the main formation pathways of c-C3H2 in cold molecular cloud cores. (b) Net percentage contributions of the main formation pathways of c-C3H2 during the hot-core collapse stage. (c) Net percentage contributions of the main formation pathways of c-C3H2 during the hot-core warm-up stage. (d) Net percentage contributions of the main destruction pathways of c-C3H2 in cold molecular cloud cores. (e) Net percentage contributions of the main destruction pathways of c-C3H2 during the hot-core collapse stage. (f) Net percentage contributions of the main destruction pathways of c-C3H2 during the hot-core warm-up stage. |
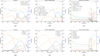 |
Fig. 5 Net percentage contributions of the formation and destruction pathways of C4H in cold and hot cores. (a) Net percentage contributions of the main formation pathways of C4H in cold molecular cloud cores. (b) Net percentage contributions of the main formation pathways of C4H during the hot-core collapse stage. (c) Net percentage contributions of the main formation pathways of C4H during the hot-core warm-up stage. (d) Net percentage contributions of the main destruction pathways of C4H in cold molecular cloud cores. (e) Net percentage contributions of the main destruction pathways of C4H during the hot-core collapse stage. (f) Net percentage contributions of the main destruction pathways of C4H during the hot-core warm-up stage. |
Acknowledgements
This work is supported by National Key R&D Program of China under grant 2023YFA1608204, the National Natural Science Foundation of China grant 12550003 and the Guangxi Talent Programme (Highland of Innovation Talents). This work is based on observations carried out under project number 042-19, with the IRAM 30 m telescope. N.Y.-T. acknowledges support from the National Natural Science Foundation of China (grant Nos. 12473023), the University Annual Scientific Research Plan of Anhui Province (Nos. 2023AH030052). Y.L. acknowledges support from the Leading Innovation and Entrepreneurship Team of Zhejiang Province of China (grant No. 2023R01008) and the Key R&D Program of Zhejiang, China (grant No. 2024SSYS0012). D.H.-Q. acknowledges support from the National Key R&D program of China grant (2025YFE0108200) and the National Natural Science Foundation of China (No. 12373026). K.Y. acknowledges supports from the National Natural Science Foundation of China under Grant Number 12503031, the Postdoctoral Fellowship Program of CPSF under Grant Number GZC20252099, the Shanghai Postdoctoral Excellence Program (No. 2024379), the Natural Science Foundation of Shanghai (No. 25ZR1402267) and the Yangyang Development Fund. IRAM is supported by INSU/CNRS (France), MPG (Germany) and IGN (Spain).
References
- Awad, Z., & Viti, S. 2022, MNRAS, 511, 3, 3832 [NASA ADS] [CrossRef] [Google Scholar]
- Aikawa, Y., Ohashi, N., Inutsuka, S.-ichiro, et al. 2001, ApJ, 552, 2, 639 [NASA ADS] [CrossRef] [Google Scholar]
- Canosa, A., Páramo, A., Le Picard, S. D., et al. 2007, Icarus, 187, 2, 558 [NASA ADS] [CrossRef] [Google Scholar]
- Fontani, F., Rivilla, V. M., Roueff, E., et al. 2025, A&A, 700, A245 [NASA ADS] [CrossRef] [EDP Sciences] [Google Scholar]
- Fossé, D., Cernicharo, J., Gerin, M., et al. 2001, ApJ, 552, 1, 168 [NASA ADS] [CrossRef] [Google Scholar]
- Gianturco, F. A., Grassi, T., & Wester, R. 2016, J. Phys. B Atom. Mol. Phys., 49, 204003 [Google Scholar]
- Ginsburg, A., Bressert, E., Bally, J., et al. 2012, ApJ, 758, L29 [NASA ADS] [CrossRef] [Google Scholar]
- Harada, N., & Herbst, E. 2008, ApJ, 685, 1 [Google Scholar]
- Herbst, E., & van Dishoeck, E. F. 2009, ARA&A, 47, 427 [Google Scholar]
- Herbst, E., & Osamura, Y. 2008, ApJ, 679, 1670 [NASA ADS] [CrossRef] [Google Scholar]
- Irvine, W. M., Hoglund, B., Friberg, P., et al. 1981, ApJ, 248, L113 [NASA ADS] [CrossRef] [Google Scholar]
- Liu, Y., Wang, J., Liu, S., et al. 2024, ApJ, 969, 33 [Google Scholar]
- Loison, J.-C., Wakelam, V., Hickson, K. M., et al. 2014, MNRAS, 437, 930 [Google Scholar]
- Loison, J.-C., Agúndez, M., Wakelam, V., et al. 2017, MNRAS, 470, 4075 [Google Scholar]
- Lucas, R., & Liszt, H. S. 2000, A&A, 358, 1069 [NASA ADS] [Google Scholar]
- Madden, S. C., Irvine, W. M., Matthews, H. E., et al. 1989, AJ, 97, 1403 [NASA ADS] [CrossRef] [Google Scholar]
- Müller H. S. P., Schlöder F., Stutzki J., & Winnewisser G., 2005, JMoSt, 742, 215 [Google Scholar]
- Olano, C. A., Walmsley, C. M., & Wilson, T. L. 1988, A&A, 196, 194 [NASA ADS] [Google Scholar]
- Reid, M. J., Menten, K. M., Brunthaler, A., et al. 2014, ApJ, 783, 130 [Google Scholar]
- Remijan, A., Scolati, H. N., Burkhardt, A. M., et al. 2023, ApJ, 944, L45 [NASA ADS] [CrossRef] [Google Scholar]
- Rodgers, S. D., & Charnley, S. B. 2003, ApJ, 585, 355 [NASA ADS] [CrossRef] [Google Scholar]
- Ruaud, M., Wakelam, V., & Hersant, F. 2016, MNRAS, 459, 3756 [Google Scholar]
- Sakai, N., & Yamamoto, S. 2013, Chem. Rev., 113, 8981 [Google Scholar]
- Sakai, N., Sakai, T., Hirota, T., et al. 2008, ApJ, 672, 371 [Google Scholar]
- Taniguchi, K., Gorai, P., Tan, J. C., et al. 2024, A&A, 692, A65 [NASA ADS] [CrossRef] [EDP Sciences] [Google Scholar]
- Takakuwa, S., Ohashi, N., & Aikawa, Y. 2011, ApJ, 728, 101 [Google Scholar]
- Thaddeus, P., Vrtilek, J. M., & Gottlieb, C. A. 1985, ApJ, 299, L63 [NASA ADS] [CrossRef] [Google Scholar]
- Wakelam, V., Gratier, P., Loison, J.-C., et al. 2024, A&A, 689, A63 [NASA ADS] [CrossRef] [EDP Sciences] [Google Scholar]
Appendix A.1 The spatial distribution maps and spectral lines of all sources
Appendix B Source information and observing parameters in hot cores
Source information and observing parameters in hot cores.
Spectral detection information of C4H 9–8, c-C3H2 2–1, and H13CO+ 1–0.
Information parameters for the map setting of C4H 9–8, c-C3H2 2–1, and H13CO+ 1–0 in hot cores.
Distribution information of C4H 9–8, c-C3H2 2–1, and H13CO+ 1–0.
Observed data for the C4H, c-C3H2, and H13CO+ lines.
Colunm density & relative abundance of C4H, c-C3H2 and H13CO+.
All Tables
Information parameters for the map setting of C4H 9–8, c-C3H2 2–1, and H13CO+ 1–0 in hot cores.
All Figures
|
Fig. 1 Velocity-integrated intensity maps and spatial averaged spectra of C4H 9–8, c-C3H2 2–1, H13CO+ 1–0, and H42α. The source names are presented in the maps and spectra. The grey scale colour at the right is in units of K km s−1. (a and b) Velocity-integrated intensity maps of G015.03–00.67, where panel a shows C4H 9–8 (red contours) overlaid on c-C3H2 2–1 (blue contours and grey scale) and panel b shows H42α (magenta contours) overlaid on H13CO+ 1–0 (black contours and grey scale). The excitation peak of H42α is marked with a magenta five-pointed star in panel a–d Spectra of C4H at 85 672.5793 MHz and c-C3H2 at 85 338.8940 MHz in the green and cyan box of G015.03-00.67. The detailed mapping information of all sources for C4H 9–8, c-C3H2 2–1 and H13CO+ 1–0 are listed in Table B.3. |
| In the text | |
|
Fig. 2 Relation between c-C3H2/H13CO+ and C4H/H13CO+ abundance ratios. Data are from 31 regions in 22 hot cores (red points) and 22 regions in 19 cold cores (blue points). |
| In the text | |
|
Fig. 3 Temporal evolution of c-C3H2, C4H, and HCO+ abundances predicted by models in cold core and hot core (warm-up). |
| In the text | |
|
Fig. 4 Net percentage contributions of the formation and destruction pathways of c-C3H2 in cold and hot cores. (a) Net percentage contributions of the main formation pathways of c-C3H2 in cold molecular cloud cores. (b) Net percentage contributions of the main formation pathways of c-C3H2 during the hot-core collapse stage. (c) Net percentage contributions of the main formation pathways of c-C3H2 during the hot-core warm-up stage. (d) Net percentage contributions of the main destruction pathways of c-C3H2 in cold molecular cloud cores. (e) Net percentage contributions of the main destruction pathways of c-C3H2 during the hot-core collapse stage. (f) Net percentage contributions of the main destruction pathways of c-C3H2 during the hot-core warm-up stage. |
| In the text | |
|
Fig. 5 Net percentage contributions of the formation and destruction pathways of C4H in cold and hot cores. (a) Net percentage contributions of the main formation pathways of C4H in cold molecular cloud cores. (b) Net percentage contributions of the main formation pathways of C4H during the hot-core collapse stage. (c) Net percentage contributions of the main formation pathways of C4H during the hot-core warm-up stage. (d) Net percentage contributions of the main destruction pathways of C4H in cold molecular cloud cores. (e) Net percentage contributions of the main destruction pathways of C4H during the hot-core collapse stage. (f) Net percentage contributions of the main destruction pathways of C4H during the hot-core warm-up stage. |
| In the text | |
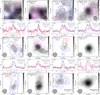 |
Fig. A.1 Same as Fig. 1 but for more sources. |
| In the text | |
Current usage metrics show cumulative count of Article Views (full-text article views including HTML views, PDF and ePub downloads, according to the available data) and Abstracts Views on Vision4Press platform.
Data correspond to usage on the plateform after 2015. The current usage metrics is available 48-96 hours after online publication and is updated daily on week days.
Initial download of the metrics may take a while.