Open Access
Fig. 3.
Download original image
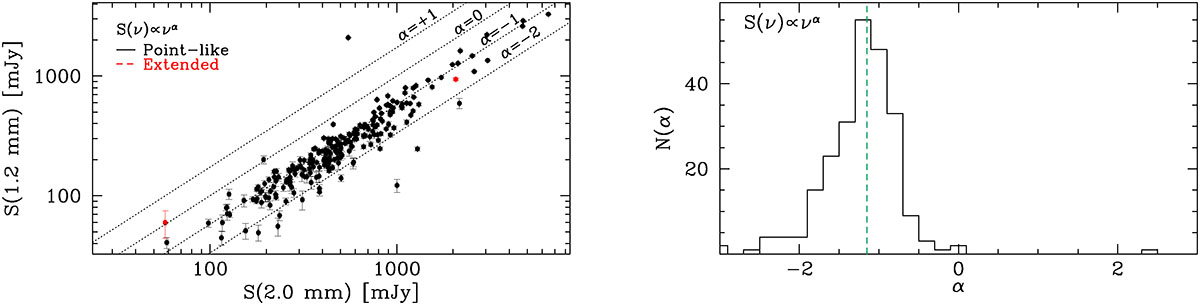
Spectral index α based on the NIKA2 1.2–2.0 mm measurements, defined as S(ν)∝να. Left: Position of the NIKA2 PCCS2 sources in the 1.2 vs. 2.0 mm fluxes space. The diagonal lines represent the relation between the two NIKA2 bands for different values of α. Right: Distribution of α of the NIKA2 PCCS sources.
Current usage metrics show cumulative count of Article Views (full-text article views including HTML views, PDF and ePub downloads, according to the available data) and Abstracts Views on Vision4Press platform.
Data correspond to usage on the plateform after 2015. The current usage metrics is available 48-96 hours after online publication and is updated daily on week days.
Initial download of the metrics may take a while.