| Issue |
A&A
Volume 708, April 2026
|
|
|---|---|---|
| Article Number | L12 | |
| Number of page(s) | 8 | |
| Section | Letters to the Editor | |
| DOI | https://doi.org/10.1051/0004-6361/202659418 | |
| Published online | 13 April 2026 | |
Letter to the Editor
NIKA2 unveils and pinpoints the Planck compact sources
1
Institut de Radioastronomie Millimétrique (IRAM), 300 rue de la Piscine, 38400 Saint-Martin-d’Hères, France
2
Univ. Grenoble Alpes, CNRS, IPAG, 38000 Grenoble, France
3
Institut de Radioastronomie Millimétrique (IRAM), Avenida Divina Pastora 7, Local 20, E-18012 Granada, Spain
4
Université Côte d’Azur, Observatoire de la Côte d’Azur, CNRS, Laboratoire Lagrange, France
5
School of Physics and Astronomy, Cardiff University, Queen’s Buildings, The Parade, Cardiff CF24 3AA, UK
6
Université Paris Cité, Université Paris-Saclay, CEA, CNRS, AIM, F-91191 Gif-sur-Yvette, France
7
Instituto de Astrofísica e Ciências do Espaço, Universidade de Lisboa-OAL, Tapada da Ajuda, PT1349-018 Lisboa, Portugal
8
Departamento de Física, Faculdade de Ciências da Universidade de Lisboa, Campo Grande, PT1749-016 Lisboa, Portugal
9
Aix Marseille Univ, CNRS, CNES, LAM (Laboratoire d’Astrophysique de Marseille), Marseille, France
10
Institut Néel, CNRS, Université Grenoble Alpes, France
11
Université de Strasbourg, CNRS, Observatoire astronomique de Strasbourg, UMR 7550, 67000 Strasbourg, France
12
Univ. Grenoble Alpes, CNRS, LPSC-IN2P3, 53, av. des Martyrs, 38000 Grenoble, France
13
Dipartimento di Fisica, Sapienza Università di Roma, Piazzale Aldo Moro 5, I-00185 Roma, Italy
14
Institute for Research in Fundamental Sciences (IPM), School of Astronomy, Tehran, Iran
15
Centro de Astrobiología (CSIC-INTA), Torrejón de Ardoz, 28850, Madrid, Spain
16
Aix Marseille Univ, CNRS/IN2P3, CPPM, Marseille, France
17
National Observatory of Athens, Institute for Astronomy, Astrophysics, Space Applications and Remote Sensing, Ioannou Metaxa and Vasileos Pavlou, GR-15236 Athens, Greece
18
Department of Astrophysics, Astronomy & Mechanics, Faculty of Physics, University of Athens, GR-15784 Athens, Greece
19
High Energy Physics Division, Argonne National Laboratory, 9700 South Cass Av., Lemont, IL 60439, USA
20
LUX, Observatoire de Paris, PSL Research University, CNRS, Sorbonne Université, UPMC, 75014 Paris, France
21
Institute of Space Sciences (ICE), CSIC, Campus UAB, Carrer de Can Magrans s/n, E-08193 Barcelona, Spain
22
ICREA, Pg. Lluís Companys 23 Barcelona, Spain
23
IRAP, CNRS, Université de Toulouse, CNES, UT3-UPS, (Toulouse), France
24
Dipartimento di Fisica, Università di Roma ‘Tor Vergata’, Via della Ricerca Scientifica 1, I-00133 Roma, Italy
25
School of Physics and Astronomy, University of Leeds, Leeds LS2 9JT, UK
26
Institut d’Astrophysique de Paris, Sorbonne Université, CNRS (UMR7095), Paris, France
27
University of Lyon, UCB Lyon 1, CNRS/IN2P3, IP2I, 69622 Villeurbanne, France
★ Corresponding author: This email address is being protected from spambots. You need JavaScript enabled to view it.
Received:
11
February
2026
Accepted:
15
March
2026
Abstract
Context. The Planck Catalogue of Compact Sources (PCCS2) is an unbiased census of the millimetre sky at sub-Jansky levels, and thus a valuable resource for studies of galaxy evolution. Nevertheless, its application to extra-galactic studies is hindered by its limited angular resolution of a few arcminutes.
Aims. In order to open the PCCS2 for an in-depth exploitation, understanding whether they are active galactic nuclei, dusty star forming galaxies, proto-clusters, or chance alignments is paramount. Improving the positional information and angular resolution will also be beneficial in this quest. Here we aim to unveil the PCCS2 sources in the northern hemisphere.
Methods. We observed the bright end of the 143 and 217 GHz PCCS2 at Dec ≥ −41.2 degrees with the New IRAM KID Arrays 2 camera (NIKA2) at 1.2 mm (260 GHz) and 2.0 mm (150 GHz). The sample includes 487 targets. Map making and source extraction were carried out with the latest version of the NIKA2 data reduction software.
Results. NIKA2 detected 54% and 77% of the targets at 1.2 and 2.0 mm. More than 95% are point-like sources, five are resolved in two components, and only 4% are extended at the resolution of NIKA2. By cross-matching the NIKA2 catalogue to the NASA Extragalactic Database, the redshift of ∼86% of the sources was found, covering the range from z ∼ 0 to 3.4, with a median z = 0.77.
Conclusions. The number density of the 143 GHz PCCS2 is 0.029 deg−2, in good agreement with model predictions. Roughly 80% of these sources are QSOs or AGN, with a median NIKA2 spectral index α = −1.15, typical of non-thermal synchrotron emission. With a positional accuracy smaller than 3.0 arcsec, and an angular resolution of 11.6 and 18.0 arcsec at 1.2 and 2.0 mm, respectively, the NIKA2 PCCS2 catalogue is hereby released to the community.
Key words: catalogs / surveys / galaxies: active / quasars: general / radio continuum: general
© The Authors 2026
 Open Access article, published by EDP Sciences, under the terms of the Creative Commons Attribution License (https://creativecommons.org/licenses/by/4.0), which permits unrestricted use, distribution, and reproduction in any medium, provided the original work is properly cited.
This article is published in open access under the Subscribe to Open model. This email address is being protected from spambots. You need JavaScript enabled to view it. to support open access publication.
1. Introduction
One of the many legacies of the ESA space mission Planck is the Planck Catalogue of Compact Sources in its second final version (PCCS2; Planck Collaboration XXVI 2016). Despite the small size of the Planck telescope (1.5 m), the excellent sensitivity and full sky coverage lead to the production of a catalogue of thousands of compact sources detected in at least one of the nine bands (30–857 GHz). The PCCS2 provides an unbiased census of the millimetre sky at sub-Jansky levels, except an exclusion zone around the Galactic plane and filaments (15% of the sky at 143 GHz and 35% at 217 GHz; Planck Collaboration XXVI 2016, their Fig. 8). The multi-band measurements made it possible to distinguish two main populations of sources, based on their colours: extragalactic radio sources (ERSs), representing the majority of the detected objects in the millimetre domain, and dusty star forming galaxies (DSFGs). Among the ERSs, the main contributors are flat-spectrum radio quasars (FSRQs) and BL Lacs, collectively known as blazars (Bonato et al. 2019).
Several works have been dedicated to the follow-up of the PCCS2 sources at different wavelengths. As part of the PASSAGES project, Berman et al. (2022) selected 24 PCCS2 DSFGs based on Planck 545–857 GHz and WISE (Wide-field Infrared Survey Explorer) colours, and observed them at 1.1 mm with the Large Millimeter Telescope Alfonso Serrano (LMT) and with the Atacama Large Millimeter/Submillimeter Array (ALMA). The sources turned out to be strongly lensed galaxies in the redshift range z = 1 − 3, therefore being among the brightest objects at these redshifts.
Massardi et al. (2016) have observed 464 sources in the southern hemisphere with the Australian Telescope Compact Array (ATCA) from 1 to 40 GHz at about the same time as Planck. They concluded that only one source is associated with each PCCS2 entry and that their spectra can be reproduced with only two power laws. (Bonato et al. 2019) presented the ALMA calibrator catalogue (ACC), and cross-correlated it to the PCCS2 sources. These authors found that the ALMA calibration sources have a large overlap with the PCCS2 sources, especially in the 100 and 217 GHz Planck bands.
The present study has a similar goal for the millimetric northern hemisphere, where previous surveys studied only a handful of the PCCS2 sources. The PCCS2 is affected by a large beam size (FWHM of 7.3 and 5.0 arcmin at 143 and 217 GHz, respectively). Using the New IRAM KID Arrays 2 camera (NIKA2; Perotto et al. 2020; Adam et al. 2018; Calvo et al. 2016; Bourrion et al. 2016; Monfardini et al. 2014) installed at the IRAM 30 m telescope, with a resolution of ∼18 and 11.6 arcsec at 150 and 260 GHz, respectively, we mapped roughly half of the accessible Planck PCCS2 sources with S(143 GHz)≥200 mJy. Our goal is to unambiguously identify them at frequencies similar to Planck, verify the reliability of the PCCS2 catalogue, find their multi-wavelength counterparts, and reveal their ERS or DSFG nature.
2. Observations
Out of the 2160 sources in the PCCS2 143 GHz catalogue, we randomly selected 448 targets with Dec ≥ −41.2 deg and
S(143 GHz)≥200 mJy for observations with the IRAM 30 m telescope (at a latitude of 37:04:06.29 north). The number of targets and the limits in flux density and declination are driven by the time-filler nature of this survey and the short scans observation strategy. The targets observed correspond to 46% of all Planck PCCS2 143 GHz sources within these constraints. The flux threshold is above the 90% PCCS2 completeness limit of S(143 GHz) = 177 ± 35 mJy (e.g. Planck Collaboration XXVI 2016; Lagache et al. 2020). To these 448 objects, 39 sources with S(217 GHz)≥130 mJy not present in the 143 GHz Planck band were added, reaching a total of 487 targets.
NIKA2 consists of three arrays of kinetic inductance detectors (KIDs), two operating at 1.2 mm (260 GHz, with 1140 detectors each) and one at 2.0 mm (150 GHz, 616 detectors). Its field of view has a diameter of ∼6.5 arcmin and roughly matches the Planck 143 GHz beam. The observations consisted of ∼8 × 5 arcmin2 scans of 3.6 minutes, obtained at constant elevation in horizontal coordinates. The observations were carried out over the period between January 2019 and March 2020, during NIKA2 technical time slots and under mediocre atmospheric conditions, with typical precipitable water vapour (pwv) above 7 mm, i.e. zenith sky opacity at 225 GHz τ225 > 0.4. At the largest pwv, the sources are likely detected only in the 2.0 mm band.
3. Data reduction and source extraction
The NIKA2 data were reduced with the PIIC dedicated software (Pointing and Imaging In Continuum; Berta & Zylka 2019; Zylka 2013), adopting the standard set-up for point-like sources in small fields and ten iterations. The NIKA2 maps of the targets are presented in Appendix A. Details about the data reduction are given in Appendix B. The median noise achieved for a point-like source in the central area of the maps is 11.2 and 2.2 mJy at 1.2 and 2.0 mm, respectively, with a median absolute deviation (m.a.d.) of 30% over the whole sample. These low flux noise values and the area observed for each target guarantee that a point-like source will be detected by NIKA2 if its emission contributes significantly to the Planck 143 GHz flux density.
Source detection and extraction was performed with PIIC by fitting a Gaussian profile to the targets. Two approaches have been adopted: using a Gaussian with fixed width corresponding to the nominal main-beam half-power beam width (HPBW) of NIKA2, namely 11.6 and 18.0 arcsec (Berta & Zylka 2019), and using a free full width at half maximum (FWHM). Sources are considered extended if FWHM > 1.25 × HPBW.
Flux densities were measured as main-beam fluxes in the case of point-like sources (the majority of cases) and free Gaussian fluxes for extended cases. Flux uncertainties were obtained from the noise rms map produced by the data reduction. In the case of extended sources, the main beam flux uncertainty was rescaled by  . The absolute flux-uncertainty has three components to be co-added in quadrature: the statistical error (as in the catalogue), the absolute calibration error (∼7% at 1.2 mm and 4% at 2.0 mm; Berta & Zylka 2025), and the uncertainty of the atmospheric extinction correction1. The absolute flux calibration is based on Uranus. A colour correction obtained by multiplying the measured fluxes by 0.94 (0.91) at 150 (260) GHz is necessary for radio sources with a spectral index α ∼ −1 (not applied to the catalogue).
Positional uncertainties are dominated by the pointing accuracy of the IRAM 30 m telescope (∼2 arcsec). The statistical uncertainty of a Gaussian profile position depends on the signal-to-noise ratio (S/N) as  (Condon et al. 1998). The two terms are added in quadrature: the maximum positional uncertainty for point-like sources is ∼2.8 arcsec at 1.2 mm and ∼3.6 arcsec at 2.0 mm.
The left and middle panels of Fig. 1 compare the NIKA2 1.2 and 2.0 mm coordinates to those determined by Planck. The median difference between NIKA2 and Planck is (7.0,−5.2) and (8.1,−6.1) arcsec at 1.2 and 2.0 mm, respectively, with a m.a.d. of (8,24) arcsec. This is well within the Planck positional uncertainty of ∼2 arcmin for a S/N = 5 source at 143 or 217 GHz. The reliability of the Planck 143 GHz PCCS2 catalogue is briefly discussed in Appendix C.
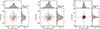 |
Fig. 1. Comparison of coordinates. Left and middle: Difference in RAcos(Dec) and Dec between NIKA2 and Planck. The two dotted circles have a diameter of 5 and 2 arcmin, equivalent to the Planck 217 GHz beam and the Planck positional accuracy for a point-like source detected with S/N ∼ 5 at 143 or 217 GHz. Right: Comparison to the coordinates of the short-wavelength counterparts identified in NED. |
Of the 487 targets, five were resolved in two distinct objects, when observed with NIKA2, bringing the total number of sources to 492. NIKA2 detected 246 and 368 sources with S/N ≥ 3 at 1.2 and 2.0 mm, respectively. Of these, 242 were detected in both bands. The extracted catalogue includes 349 point-like sources and 19 extended ones detected by NIKA2 with S/N ≥ 3. Bing et al. (2023) showed that the fraction of NIKA2 spurious detections is between 20% and 5% at 3 ≤ S/N < 5; only four NIKA2 PCCS2 sources are in this regime. Furthermore, 30 targets have a NIKA2 counterpart, but their fluxes are below the S/N = 3 limit due to poor atmospheric conditions during the observations. Table 1 summarises the statistics of the PCCS2 NIKA2 counterparts. The NIKA2 PCCS2 catalogue can be used as a reference for pointing and focusing of millimetre telescopes with a beam size comparable to or larger than that of the IRAM 30 m telescope. Appendix D describes its content.
Statistics of the NIKA2 PCCS2 catalogue.
4. Properties of the PCCS2 sources
Based on the NIKA2 coordinates, the sources have been matched to counterparts at other wavelengths, mainly optical and near-infrared (NIR), using the NASA/IPAC Extragalactic Database (NED2) and a search radius as large as the NIKA2 2.0 mm beam. The closest neighbour match was chosen as the counterpart. A total of 371 sources have a secure identification (Table 1).
The right panel of Fig. 1 shows the comparison of the NIKA2 2.0 mm coordinates and those of the optical-NIR counterparts found in NED. The median coordinates difference between the NIKA2 2.0 mm sources and their NED counterparts is (0.27,−0.21) arcsec, with a m.a.d. of (1.4,1.7) arcsec.
Out of the 371 PCCS2 counterparts identified in NED, 327 have a redshift estimate, and 260 are classified as quasi-stellar objects (QSOs) or active galactic nuclei (AGN). The remaining 30% are nearby and intermediate redshift galaxies (mainly spirals and star forming), a few Galactic objects, and sources without a classification. Figure 2 shows the redshift distribution of the identified counterparts of the PCCS2 targets. Their median redshift is z = 0.77 and for the QSOs/AGN it is z = 0.90.
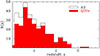 |
Fig. 2. Redshift distribution of the short-wavelength counterparts of the PCCS2 sources, identified in the NED database. |
The left panel of Fig. 3 presents the flux of the sources in the NIKA2 1.2 vs. 2.0 mm space. Describing the millimetre emission as a power law S(ν)∝να, their spectral index α is defined by the NIKA2 flux ratio. The right panel of Fig. 3 shows the distribution of α for sources detected in both bands. The median spectral index is α = −1.15, with a m.a.d. of 0.25. This value is typical of non-thermal synchrotron emission and is in agreement with the majority of these PCCS2 sources being QSOs and AGN.
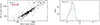 |
Fig. 3. Spectral index α based on the NIKA2 1.2–2.0 mm measurements, defined as S(ν)∝να. Left: Position of the NIKA2 PCCS2 sources in the 1.2 vs. 2.0 mm fluxes space. The diagonal lines represent the relation between the two NIKA2 bands for different values of α. Right: Distribution of α of the NIKA2 PCCS sources. |
5. Conclusions
We presented the NIKA2 observations of 487 Planck PCCS2 sources in the northern hemisphere and we released the 1.2 and 2.0 mm catalogue resulting from these data. With 54% and 77% detection rate at 1.2 and 2.0 mm, respectively, NIKA2 confirms the reliability of the Planck catalogue and refines its results (Planck Collaboration XXVI 2016).
This survey reveals that more than 90% of the detected sources are point-like at the resolution of NIKA2 on the IRAM 30 m telescope. With 381 such sources distributed across ∼31 000 deg2, the density of the NIKA2 PCCS2 catalogue is roughly one source for every sky box of 10 deg per side. Roughly 70% of the detected sources are not included in the current pointing catalogues adopted at the IRAM 30 m telescope. The high positional accuracy, relatively small beam size, and even distribution across the northern sky (except the Galactic plane) make this catalogue a valuable pointing reference for millimetre telescopes such as the IRAM 30 m. The bright end of this sub-sample can be considered a good reference for focusing the telescope.
A cross-match to the NED database demonstrated that at least ∼80% of the detected sources are QSOs or AGN. The majority exhibits a 1.2 versus 2.0 mm spectral slope typical of radio galaxies, consistent with non-thermal synchrotron emission. Given the known variable nature of the fluxes of QSOs and radio galaxies, it is worth pointing out that in its current status the PCCS2 catalogue is not suited for absolute flux calibration. A systematic flux monitoring is necessary to identify those NIKA2 PCCS2 sources stable enough in time to be used as calibrators (e.g. Agudo et al. 2018; Rocha et al. 2023; Kam et al. 2025).
We intend to cover the Planck 353 GHz band with the same IRAM 30 m observing strategy in order to measure the increasing fraction of DSFGs over ERS. The cross-over wavelength is shown by Planck Collaboration XXVI (2016) to be roughly 1 mm. The bright end of the DSFGs population will likely include gravitationally lensed galaxies (e.g. Negrello et al. 2010).
Data availability
The NIKA2 PCCS2 catalogue (Appendix D) is available at the CDS via https://cdsarc.cds.unistra.fr/viz-bin/cat/J/A+A/708/L12
Acknowledgments
We are grateful to the anonymous referee for their useful comments and suggestions. We would like to thank the IRAM staff for their support during the observation campaigns. The NIKA2 dilution cryostat has been designed and built at the Institut Néel. In particular, we acknowledge the crucial contribution of the Cryogenics Group, and in particular Gregory Garde, Henri Rodenas, Jean-Paul Leggeri, Philippe Camus. This work has been partially funded by the Foundation Nanoscience Grenoble and the LabEx FOCUS ANR-11-LABX-0013. This work is supported by the French National Research Agency under the contracts “MKIDS”, “NIKA” and ANR-15-CE31-0017 and in the framework of the “Investissements d’avenir” program (ANR-15-IDEX-02). This work has been supported by the GIS KIDs. This work has benefited from the support of the European Research Council Advanced Grant ORISTARS under the European Union’s Seventh Framework Programme (Grant agreement No. 291294). R. A. acknowledges support from the Programme National Cosmology et Galaxies (PNCG) of CNRS/INSU with INP and IN2P3, co-funded by CEA and CNES. R. A. was supported by the French government through the France 2030 investment plan managed by the National Research Agency (ANR), as part of the Initiative of Excellence of Université Côte d’Azur under reference number ANR-15-IDEX-01. A. Maury acknowledges support the funding from the European Research Council (ERC) under the European Union’s Horizon 2020 research and innovation programme (Grant agreement No. 101098309 – PEBBLES). This research has made use of the NASA/IPAC Extragalactic Database (NED), which is funded by the National Aeronautics and Space Administration and operated by the California Institute of Technology.
References
- Adam, R., Adane, A., Ade, P. A. R., et al. 2018, A&A, 609, A115 [NASA ADS] [CrossRef] [EDP Sciences] [Google Scholar]
- Agudo, I., Thum, C., Molina, S. N., et al. 2018, MNRAS, 474, 1427 [NASA ADS] [CrossRef] [Google Scholar]
- Berman, D. A., Yun, M. S., Harrington, K. C., et al. 2022, MNRAS, 515, 3911 [Google Scholar]
- Berta, S., & Zylka, R. 2019, Welcome to the PIIC, https://www.iram.fr/ gildas/dist/piic.pdf [Google Scholar]
- Berta, S., & Zylka, R. 2025, PIIC summary of calibration, https://www.iram.fr/ gildas/dist/piic-dafs.pdf [Google Scholar]
- Bing, L., Béthermin, M., Lagache, G., et al. 2023, A&A, 677, A66 [NASA ADS] [CrossRef] [EDP Sciences] [Google Scholar]
- Bonato, M., Liuzzo, E., Herranz, D., et al. 2019, MNRAS, 485, 1188 [NASA ADS] [CrossRef] [Google Scholar]
- Bourrion, O., Benoit, A., Bouly, J. L., et al. 2016, J. Instrum., 11, P11001 [Google Scholar]
- Calvo, M., Benoît, A., Catalano, A., et al. 2016, J. Low Temp. Phys., 184, 816 [CrossRef] [Google Scholar]
- Condon, J. J., Cotton, W. D., Greisen, E. W., et al. 1998, AJ, 115, 1693 [Google Scholar]
- Haslam, C. G. T. 1973, Kleinheubacher Ber., 16, 451 [Google Scholar]
- Kam, M., Nagai, H., Kino, M., et al. 2025, ApJ, 994, 196 [Google Scholar]
- Katsioli, S., Xilouris, E. M., Kramer, C., et al. 2023, A&A, 679, A7 [CrossRef] [EDP Sciences] [Google Scholar]
- Lagache, G., Béthermin, M., Montier, L., Serra, P., & Tucci, M. 2020, A&A, 642, A232 [NASA ADS] [CrossRef] [EDP Sciences] [Google Scholar]
- Massardi, M., Bonaldi, A., Bonavera, L., et al. 2016, MNRAS, 455, 3249 [Google Scholar]
- Monfardini, A., Adam, R., Adane, A., et al. 2014, J. Low Temp. Phys., 176, 787 [NASA ADS] [CrossRef] [Google Scholar]
- Negrello, M., Hopwood, R., De Zotti, G., et al. 2010, Science, 330, 800 [NASA ADS] [CrossRef] [Google Scholar]
- Perotto, L., Ponthieu, N., Macías-Pérez, J. F., et al. 2020, A&A, 637, A71 [NASA ADS] [CrossRef] [EDP Sciences] [Google Scholar]
- Planck Collaboration XXVI. 2016, A&A, 594, A26 [NASA ADS] [CrossRef] [EDP Sciences] [Google Scholar]
- Rocha, G., Keskitalo, R., Partridge, B., et al. 2023, A&A, 669, A92 [NASA ADS] [CrossRef] [EDP Sciences] [Google Scholar]
- Zylka, R. 2013, Astrophysics Source Code Library [record ascl:1303.011] [Google Scholar]
The atmospheric extinction correction is given by eτ ⋅ airmass, where τ is the zenith opacity. Simple error propagation shows that for the median τ1.2 mm = 0.67, τ2.0 mm = 0.39 and E1 = 41 deg of the sample, a 5% uncertainty on τ corresponds to a 5% uncertainty on extinction correction and flux density at 1.2 mm and 3% at 2.0 mm.
the colour correction from the Uranus calibration adopted for NIKA2 and a power law with the median NIKA2 PCCS2 spectral index is estimated to be 1.01. The colour correction from the cosmic microwave background adopted for the Planck calibration to the same power law is estimated to be 0.97. The colour correction from 143 GHz to 150 GHz for the same spectral index is 0.95, and from 217 GHz to 260 GHz is 0.81.
Appendix A: NIKA2 maps
A collection of the 1.2 and 2.0 mm maps of the PCCS2 targets observed with NIKA2 is presented here (Figs. A.1 and A.2). The 2.0 mm data processing failed for eight targets, likely because of data acquisition problems, therefore the corresponding maps are blank in Fig. A.2.
 |
Fig. A.1. NIKA2 1.2 mm maps of the PCCS2 targets. |
 |
Fig. A.2. NIKA2 2.0 mm maps of the PCCS2 targets. |
Appendix B: Data reduction details
NIKA2 data consist of scans of a portion of the sky comprising the target. The signal is recorded with a frequency of ∼23.8 Hz, such that the data structure is a time line covering the duration of a scan, with this sampling frequency.
PIIC is the IRAM software designed to reduce and analyse NIKA2 data Berta & Zylka (2019). Single point-like sources in small fields are the simplest NIKA2 scan case. Data reduction is carried out following an iterative process, during which the source signal is increasingly retrieved.
At each iteration, the data are flat-fielded and the signal is calibrated from instrumental to physical units. Sky noise is subtracted in two steps: first the median of all KIDs (the so-called ‘common mode’) is subtracted; then the residual sky contribution to each KID is further subtracted using only the 16 best correlating other KIDs. The KIDs with the noisiest time-lines are identified and excluded during these sky subtraction steps. The extinction correction is computed transforming the Zenith sky opacity measured by the IRAM tau-meter in the south-west direction to the line of sight opacity using a transformation equation determined by the NIKA2 IRAM calibration team for each NIKA2 science week (Berta & Zylka 2025).
Finally, maps are built by adding up the signal of all records, of all KIDs, of all scans targeting the same source onto the map pixel grid. The signal of each record/KID is distributed on this grid, taking into account the NIKA2 beam (Zylka 2013; Haslam 1973).
In the iterative loop, during the i-th iteration, the sources are identified as all pixels with S/N ≥ 4 in the map produced at the previous iteration. They are then subtracted from the time-lines before applying the corrections listed above and are added back after all operations have been performed. A total of 10 iterations were used for the PCCS2 targets.
B.1. Alternative data processing
The NIKA2 PCCS2 data have been reduced also with an alternative pipeline based on the Interactive Data Language (IDL), described by Perotto et al. (2020). Similarly to PIIC, the signal time-lines of each KID are de-correlated from the sky emission and low frequency harmonic modes are subtracted at the sub-scan level in order to remove the electronic noise. Opacity-correction is done along the line of sight by measuring the total power on each KID and applying the inverse of the average attenuation to the data. Maps are then built by weighed co-addition of the records of each KID time line at the appropriate sky coordinates, assigning the signal of each KID to the nearest pixel. During the iterative processing, the source signal – identified above a given S/N threshold in the map – is subtracted from the time-lines at the early stages of each iteration and added back at the end. Three iterations were employed for the PCCS2 targets.
Figure B.1 compares the NIKA2 PCCS2 fluxes extracted from the maps obtained with the PIIC and IDL data reduction pipelines. The two are in good agreement, with a median absolute deviation of the flux differences of ∼61 and ∼23 mJy at 1.2 and 2.0 mm, respectively.
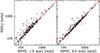 |
Fig. B.1. Comparison of the NIKA2 PCCS2 fluxes extracted from the maps obtained with the PIIC data reduction and the alternative IDL pipeline. Left: 1.2 mm data. Right: 2.0 mm data. |
Appendix C: Reliability of PCCS2
It is now possible to verify the reliability of PCCS2, that is the fraction of sources above a given S/N, that are real (Planck Collaboration XXVI 2016). Limiting to the 143 GHz PCCS2 survey, 448 compact sources were observed, of which 86 have no NIKA2 counterpart. This observed detection rate of 82% is close to the 80% reliability reported as the PCCS2 goal. When limiting to the PCCS2 source with reliability flag equal to 99 (the highest value), the NIKA2 detection rate becomes 94%.
After correction for completeness, C = 0.9 × 0.46 (Sect. 2 for the efficiency of 46% and Planck Collaboration XXVI 2016, for the 90% reliability), the integrated 2.0 mm counts can be calculated as N(> S) = (448 − 86)/Ω/C ≃ 0.028 ± 0.002 deg−2 for S(143 GHz)≥200 mJy. Here Ω is the sky coverage of our initial selection (Dec ≥ −41.2), that is ∼31120 deg2 taking into account the avoidance region of the 143 GHz PCCS2 catalogue (∼15% of the entire sky). The quoted uncertainty is given by the Poisson error only. The measured counts are in good agreement with the number counts of 0.025 deg−2 predicted by the Lagache et al. (2020) model.
Figure C.1 compares the NIKA2 2.0 mm and the Planck 143 GHz flux densities of the PCCS2 sources. No correction for the different observed frequencies, nor for the different intrinsic spectra of the calibration sources has been applied.3 The two measurements are in good agreement, modulo the limitation of such comparison and the possible variability of the detected QSOs, thus further confirming the quality of the Planck PCCS2 143 GHz catalogue.
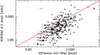 |
Fig. C.1. Comparison between the NIKA2 2.0 mm and the Planck flux density of the PCCS2 targets detected by NIKA2. No colour or calibration corrections have been applied. |
The most prominent outliers have a flux discrepancy of up to a factor of ∼3 between the two methods. We have traced these cases to observations in very degraded conditions where the 2.0 mm opacity exceeded 0.9. The source detection is well established in both methods but the flux uncertainty is very large.
Appendix D: Catalogue description
The NIKA2 PCCS2 catalogue is released to the astronomic community in electronic form with this publication. For each PCCS2 target, it contains the following pieces of information.
-
Column 1:
Running number of the PCCS2 targets, from 1 to 487. The few targets that were resolved in two independent components have a double entry, identified by the same running number (only sources nr. 117, 228, 277, 297, 368).
-
Column 2:
NIKA2 1.2 mm flux density, in units of mJy.
-
Column 3:
NIKA2 1.2 mm flux density error, in units of mJy.
-
Column 4:
NIKA2 2.0 mm flux density, in units of mJy.
-
Column 5:
NIKA2 2.0 mm flux density error, in units of mJy.
-
Column 6:
NIKA2 1.2 mm Right Ascension in degrees (J2000).
-
Column 7:
NIKA2 1.2 mm Declination in degrees (J2000).
-
Column 8:
NIKA2 2.0 mm Right Ascension in degrees (J2000).
-
Column 9:
NIKA2 2.0 mm Declination in degrees (J2000).
-
Column 10:
NIKA2 1.2 mm full width at half maximum (FWHM) of the minor axis of the Gaussian profile. If the source is point-like, this corresponds to the half power beam width (HPBW) of NIKA2 at this wavelength.
-
Column 11:
NIKA2 1.2 mm full width at half maximum (FWHM) of the major axis of the Gaussian profile. If the source is point-like, this corresponds to the half power beam width (HPBW) of NIKA2 at this wavelength.
-
Column 12:
NIKA2 2.0 mm full width at half maximum (FWHM) of the minor axis of the Gaussian profile. If the source is point-like, this corresponds to the half power beam width (HPBW) of NIKA2 at this wavelength.
-
Column 13:
NIKA2 2.0 mm full width at half maximum (FWHM) of the major axis of the Gaussian profile. If the source is point-like, this corresponds to the half power beam width (HPBW) of NIKA2 at this wavelength.
-
Column 14:
NIKA2 1.2 mm morphology flag. Its value is 0 if the target is not detected; it is 1 if it is point-like; it is 3 if it is extended; it is 21 if it is double and point-like; it is 23 if double and extended; it is negative (with same absolute values as listed here) if it has S/N < 3.
-
Column 15:
NIKA2 2.0 mm morphology flag, with the same conventions as for the 1.2 mm band.
-
Column 16:
Right Ascension of the centre of the NIKA2 maps, corresponding the Planck PCCS2 coordinates.
-
Column 17:
Declination of the centre of the NIKA2 maps, corresponding the Planck PCCS2 coordinates.
-
Column 18:
PCCS2 string.
-
Column 19:
Frequency of the PCCS parent catalogue from which the target was selected (either 143 or 217 GHz).
-
Column 20:
Name of the corresponding Planck PCCS2 source.
-
Column 21:
Planck 143 GHz flux density in units of mJy.
-
Column 22:
Planck 143 GHz flux density uncertainty in units of mJy.
-
Column 23:
Planck 217 GHz flux density in units of mJy.
-
Column 24:
Planck 217 GHz flux density uncertainty in units of mJy.
-
Column 25:
Planck 143 GHz reliability (with values from 80 to 99).
-
Column 26:
Planck 217 GHz reliability (with values from 80 to 99).
-
Column 27:
Average elevation of the NIKA2 observation.
-
Column 28:
Average sky opacity at 1.2 mm during the NIKA2 observation.
-
Column 29:
Average sky opacity at 2.0 mm during the NIKA2 observation.
-
Column 30:
IAU name of the short wavelength counterpart identified in NED.
-
Column 31:
Right Ascension of the short wavelength counterpart identified in NED.
-
Column 32:
Declination of the short wavelength counterpart identified in NED.
-
Column 33:
Separation of the NED counterpart from the NIKA2 source.
-
Column 34:
Redshift of the NED counterpart.
-
Column 35:
Redshift uncertainty of the NED counterpart.
-
Column 36:
Redshift reference.
-
Column 37:
QSO/AGN flag (1/0).
If one piece of information is missing for a given source, the value of the corresponding field is -99.99 for real numbers, -100 for integers, or n/a for strings. NIKA2 flux densities are given with the following conventions:
-
Flux density units are mJy.
-
If a source is detected with S/N ≥ 3 and is point-like, its flux density uncertainty is given by the map noise r.m.s., as described in Sect. 3.
-
If a source is detected with S/N ≥ 3 and is extended (Sect. 3), its flux density uncertainty is given by the map noise r.m.s. rescaled to the area of its Gaussian profile, as described in Sect. 3.
-
If a map is not available, the flux density and its uncertainty are set to -99.99.
-
If no source is present on the map, a flux density upper limit is given, corresponding to 3× the point-like uncertainty in that map. The flux density upper limit is negative and the corresponding r.m.s. uncertainty is positive.
-
If a source is present on the map, but its flux density is measured with S/N < 3, the value of the measured flux density is preserved, but is multiplied by -1. The uncertainty is kept positive.
The catalogue includes few non-extragalactic sources, such as the Egg Nebula (with α > 2 in Fig. 3; G080.16-06.48), IRAS 21004+7811 (a T-Tau star; G112.40+20.58), IRAS 05417+0907 (one of the closest bright-rimmed cloud in the vicinity of λOri; G196.94-10.36), IRAS 23238+7401 (a young stellar object; G117.10+12.40), NGC 1788 plus LDN 1616 (G203.51-24.72), CW Leo (a variable carbon star with a thick dust envelope; G221.44+45.06), and few planetary nebulae (IC 0418, NGC 0040, 3242, 6818, 6572, and 7009). It also includes some notable nearby galaxies: for example Messier 82 (G141.40+40.55), Messier 87 (G283.76+74.50), Messier 104 (G298.46+51.15), NGC 4261 (G281.83+67.37), and the edge-on spiral NGC 891 (G140.37-17.40; Katsioli et al. 2023).
All Tables
All Figures
|
Fig. 1. Comparison of coordinates. Left and middle: Difference in RAcos(Dec) and Dec between NIKA2 and Planck. The two dotted circles have a diameter of 5 and 2 arcmin, equivalent to the Planck 217 GHz beam and the Planck positional accuracy for a point-like source detected with S/N ∼ 5 at 143 or 217 GHz. Right: Comparison to the coordinates of the short-wavelength counterparts identified in NED. |
| In the text | |
|
Fig. 2. Redshift distribution of the short-wavelength counterparts of the PCCS2 sources, identified in the NED database. |
| In the text | |
|
Fig. 3. Spectral index α based on the NIKA2 1.2–2.0 mm measurements, defined as S(ν)∝να. Left: Position of the NIKA2 PCCS2 sources in the 1.2 vs. 2.0 mm fluxes space. The diagonal lines represent the relation between the two NIKA2 bands for different values of α. Right: Distribution of α of the NIKA2 PCCS sources. |
| In the text | |
|
Fig. A.1. NIKA2 1.2 mm maps of the PCCS2 targets. |
| In the text | |
|
Fig. A.2. NIKA2 2.0 mm maps of the PCCS2 targets. |
| In the text | |
|
Fig. B.1. Comparison of the NIKA2 PCCS2 fluxes extracted from the maps obtained with the PIIC data reduction and the alternative IDL pipeline. Left: 1.2 mm data. Right: 2.0 mm data. |
| In the text | |
|
Fig. C.1. Comparison between the NIKA2 2.0 mm and the Planck flux density of the PCCS2 targets detected by NIKA2. No colour or calibration corrections have been applied. |
| In the text | |
Current usage metrics show cumulative count of Article Views (full-text article views including HTML views, PDF and ePub downloads, according to the available data) and Abstracts Views on Vision4Press platform.
Data correspond to usage on the plateform after 2015. The current usage metrics is available 48-96 hours after online publication and is updated daily on week days.
Initial download of the metrics may take a while.