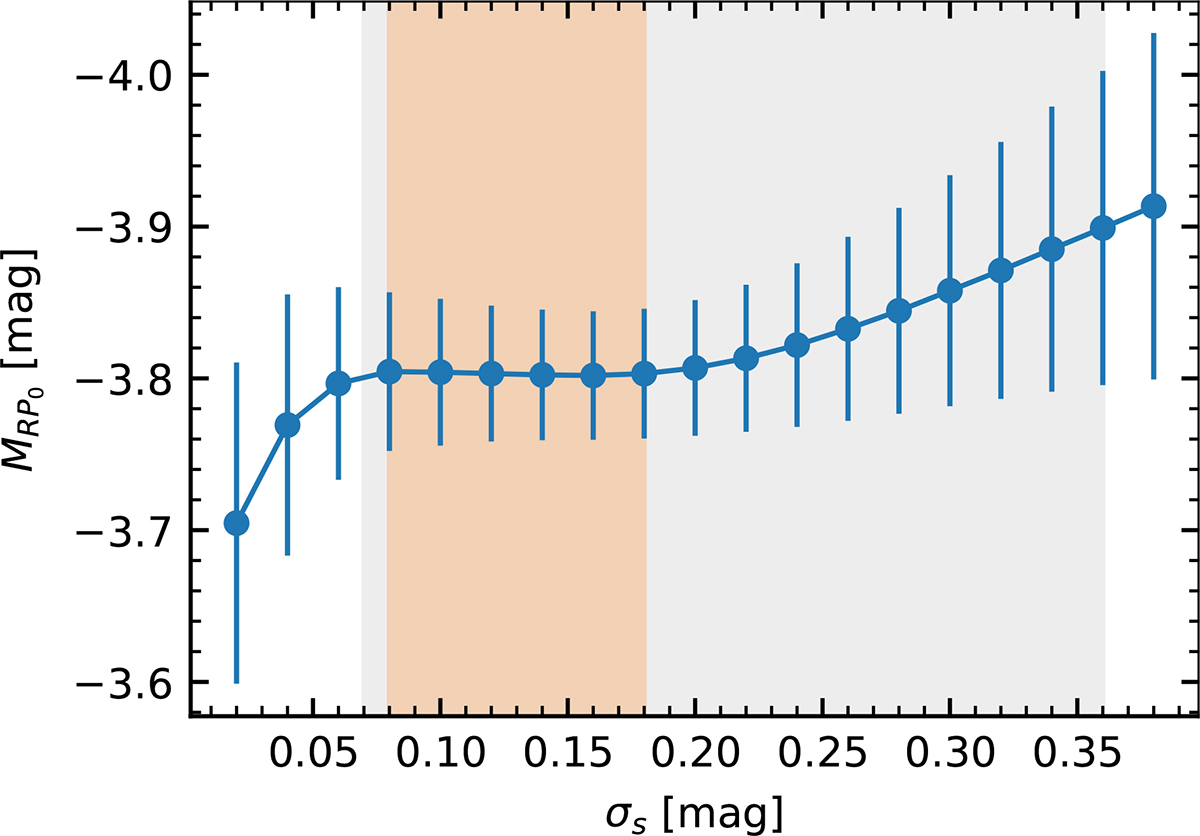
Fig. D.1.
Download original image
Variation in the mean and standard deviation of the TRGB magnitude as a function of the GLOESS smoothing parameter. The vertical grey lines indicate the range over which the absolute magnitude of the TRGB is insensitive to the smoothing value, according to A24 for their ‘SARGs’ sample. The orange shaded region was determined for the GC sample using the criterion ![]() and covers the range σs ∈ [0.08, 0.18] mag.
and covers the range σs ∈ [0.08, 0.18] mag.
Current usage metrics show cumulative count of Article Views (full-text article views including HTML views, PDF and ePub downloads, according to the available data) and Abstracts Views on Vision4Press platform.
Data correspond to usage on the plateform after 2015. The current usage metrics is available 48-96 hours after online publication and is updated daily on week days.
Initial download of the metrics may take a while.