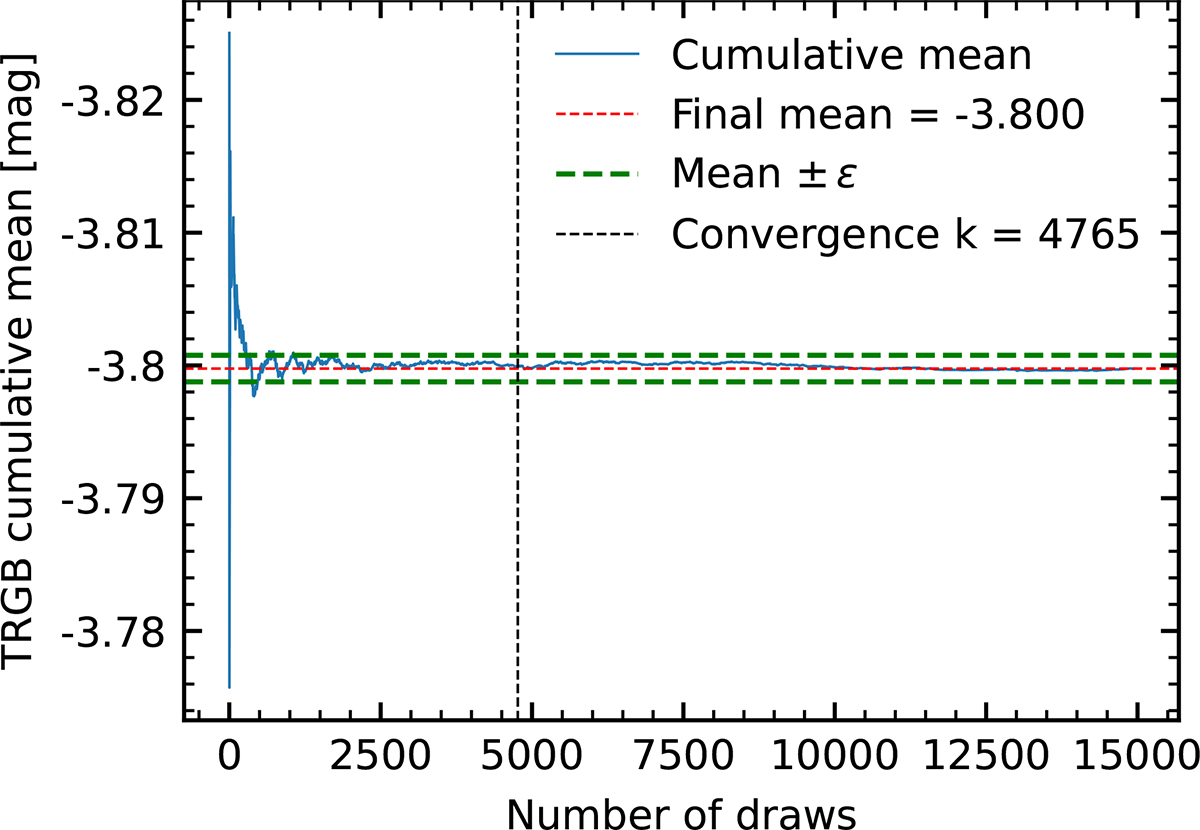
Fig. E.1.
Download original image
Convergence of the TRGB estimates in the RP band. The blue curve shows the cumulative mean TRGB absolute magnitude as a function of the number of sample draws. The red dashed line marks the final mean of the full sample. The dotted green lines indicate the final mean ±ϵ, with ϵ = 0.001 mag, and the black vertical line marks the convergence index kconv. As discussed in the text, the sample draws were randomly reordered; therefore, the exact shape of the curve may vary between permutations.
Current usage metrics show cumulative count of Article Views (full-text article views including HTML views, PDF and ePub downloads, according to the available data) and Abstracts Views on Vision4Press platform.
Data correspond to usage on the plateform after 2015. The current usage metrics is available 48-96 hours after online publication and is updated daily on week days.
Initial download of the metrics may take a while.