| Issue |
A&A
Volume 708, April 2026
|
|
|---|---|---|
| Article Number | C4 | |
| Number of page(s) | 3 | |
| Section | Stellar atmospheres | |
| DOI | https://doi.org/10.1051/0004-6361/202660062e | |
| Published online | 14 April 2026 | |
Starspots on eclipsing giant stars
I. The sample and eclipse mapping examples (Corrigendum)
1
Konkoly Observatory, HUN-REN Research Centre for Astronomy and Earth Sciences,
Konkoly Thege Miklós út 15–17,
1121
Budapest,
Hungary
2
HUN-REN CSFK, MTA Centre of Excellence, Budapest,
Konkoly Thege Miklós út 15-17,
1121
Budapest,
Hungary
3
Eötvös University, Department of Astronomy,
Pf. 32,
1518
Budapest,
Hungary
4
Department of Physics,
PO Box 64,
00014
University of Helsinki,
Finland
5
Department of Physics, Kavli Institute for Astrophysics and Space Research, Massachusetts Institute of Technology,
Cambridge,
MA
02139,
USA
6
Amateur Astronomer,
Glendale,
AZ
85308,
USA
7
Amateur Astronomer,
Missouri City,
TX
77459,
USA
8
Brorfelde Observatory,
Observator Gyldenkernes Vej 7,
4340
Tølløse,
Denmark
9
Citizen Scientist, c/o Zooniverse, Department of Physics, University of Oxford,
Denys Wilkinson Building, Keble Road,
Oxford
OX1 3RH,
UK
10
NASA Goddard Space Flight Center,
8800 Greenbelt Road,
Greenbelt,
MD
20771,
USA
11
SETI Institute,
189 Bernardo Avenue, Suite 200,
Mountain View,
CA
94043,
USA
★ Corresponding author: This email address is being protected from spambots. You need JavaScript enabled to view it.
Key words: stars: activity / binaries: eclipsing / stars: imaging / stars: late-type / stars: rotation / errata, addenda
In our original paper, we mistakenly used two different longitude definitions simultaneously in some of our figures. According to one definition, stellar longitude increases with the rotation phase, while according to the more general convention, longitude increases in the opposite direction to the phase. In line with the latter convention, we have corrected our figures, which now interpret the longitudinal migration of spots on the star in a uniform way based on both global spot modeling (red circles in the figures) and eclipse mapping (blue circles in the figures); the corrected versions of the original Figs. 12 and 14 are found below. For the same reason (applying the more general convention between longitudes and phases), the horizontal axis in the lower panel of Fig. 8, showing “spot longitude [deg.]”; actually expresses the location of the spots in the orbital phase, so the values must be divided by 360° for correct interpretation.
Similarly in the Appendix, in the second panels from the top of Figs. A.1 and A.2, and the third panel from the top of Fig. B.1, the “longitude [deg.]” values indicated on the vertical axes actually represent the location of the starspots along the orbital phase, so the values must be divided by 360° for correct interpretation.
© The Authors 2026
 Open Access article, published by EDP Sciences, under the terms of the Creative Commons Attribution License (https://creativecommons.org/licenses/by/4.0), which permits unrestricted use, distribution, and reproduction in any medium, provided the original work is properly cited.
This article is published in open access under the Subscribe to Open model. This email address is being protected from spambots. You need JavaScript enabled to view it. to support open access publication.
All Figures
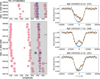 |
Fig. 1 Replacing Fig. 12 in the original paper, only the left panel was changed. Left: changing longitudes of spots of TIC 271892852 in time. Red and blue circles result from time-series photometric modeling and eclipse mapping, respectively. The shade of the blue circles reflects the contrasts of the spots from eclipse mapping. Note that the x axis of the figure covers one stellar circumference in longitude. Gray shading shows the longitudes scanned by the companion star. Three arrows mark the rotations with fitted spots whose eclipses are shown in the right panel. Right, from top to bottom: example eclipse fits revealing spots scanned during ingress, just in the middle of the eclipse, and during egress. |
| In the text | |
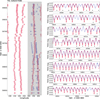 |
Fig. 2 Replacing Fig. 14 in the original paper, only the left panel was changed. Left: changing longitudes of spots of TIC 326257590 in time. Red and blue circles result from time-series photometric modeling and eclipse mapping, respectively. The shade of the blue circles reflects the contrasts of the spots from eclipse mapping. Note that the x axis of the figure covers one stellar circumference in longitude. Gray shading shows the longitudes scanned by the companion star. Right: light curve fitted by four spots. Black dots mark those eclipses that are mapped. |
| In the text | |
Current usage metrics show cumulative count of Article Views (full-text article views including HTML views, PDF and ePub downloads, according to the available data) and Abstracts Views on Vision4Press platform.
Data correspond to usage on the plateform after 2015. The current usage metrics is available 48-96 hours after online publication and is updated daily on week days.
Initial download of the metrics may take a while.