Fig. 5
Download original image
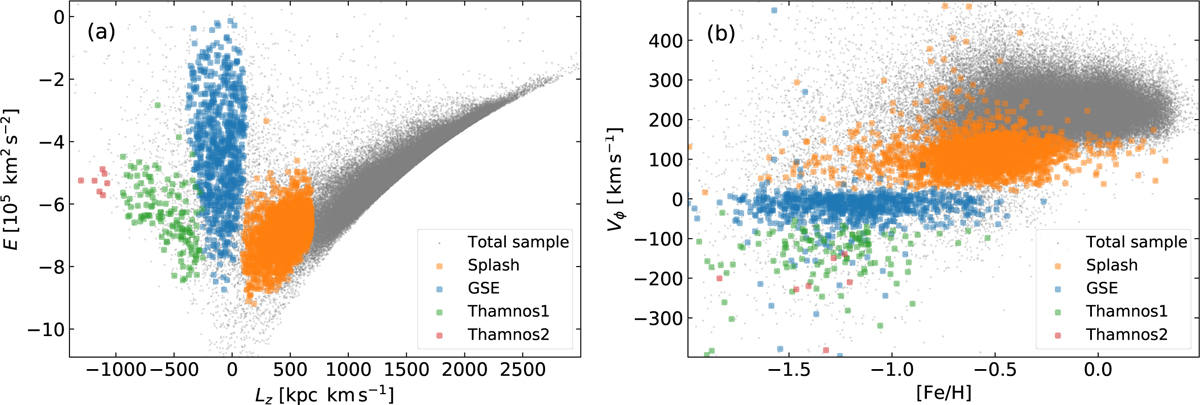
Panel a: orbital energy plotted as a function of the angular momentum. Gray dots show a scatter plot of the total sample, while the other colors and symbols correspond to the kinematic structures detected in the legend. Chemically defined halo stars were excluded from the Splash and chemically defined disk stars were excluded from the rest of the groups. Panel b: similar to the plot in panel a, but showing the rotational velocity as a function of metallicity.
Current usage metrics show cumulative count of Article Views (full-text article views including HTML views, PDF and ePub downloads, according to the available data) and Abstracts Views on Vision4Press platform.
Data correspond to usage on the plateform after 2015. The current usage metrics is available 48-96 hours after online publication and is updated daily on week days.
Initial download of the metrics may take a while.