Fig. 7
Download original image
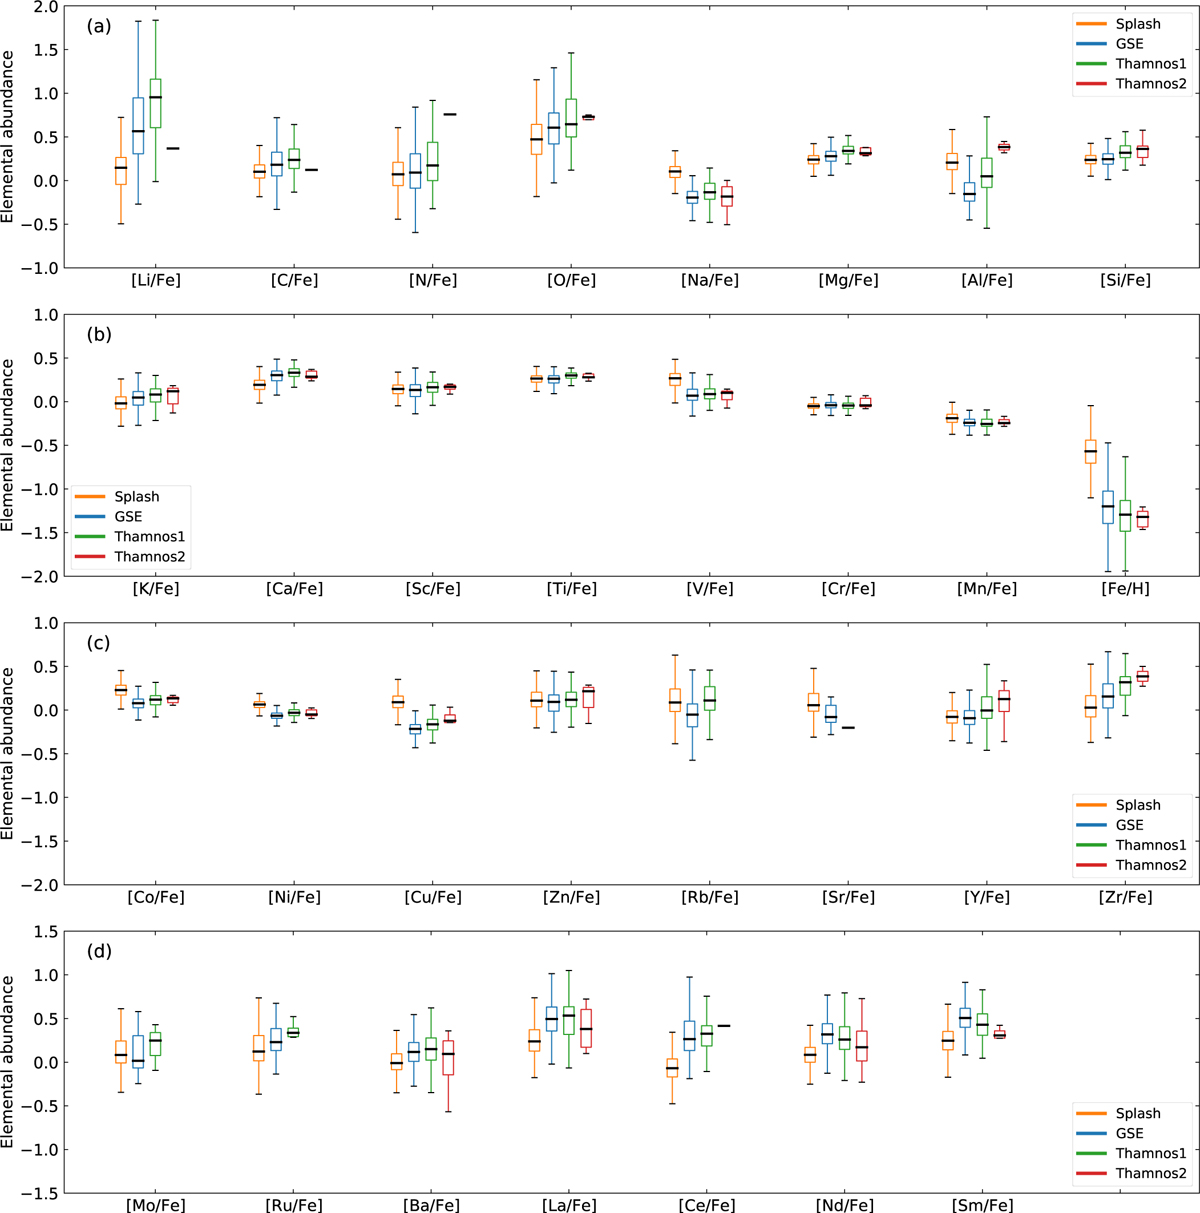
Panels a–d: individual distributions of elemental abundances for the Splash (orange box), GSE (blue box), Thamnos1 (green box), and Thamnos2 (red box), which are depicted using box plots. The analysis covers 32 chemical elements, X, related to iron, [X/Fe], and iron abundance, which is related to hydrogen, [Fe/H]. Each box plot adheres to standard conventions, with the first and third quartiles defining the box body, “whiskers” extending to minimum and maximum values, and the median shown as a black line inside each box.
Current usage metrics show cumulative count of Article Views (full-text article views including HTML views, PDF and ePub downloads, according to the available data) and Abstracts Views on Vision4Press platform.
Data correspond to usage on the plateform after 2015. The current usage metrics is available 48-96 hours after online publication and is updated daily on week days.
Initial download of the metrics may take a while.