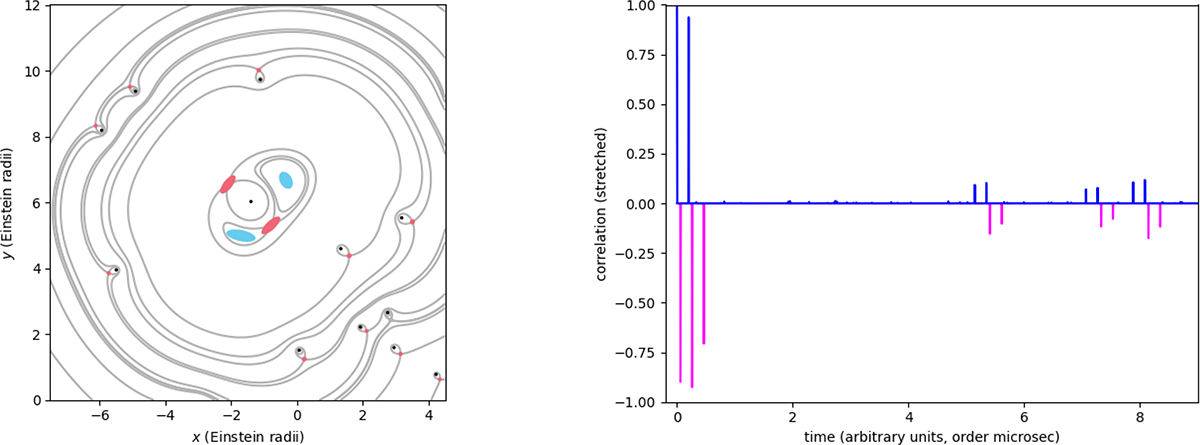
Fig. 2.
Download original image
Left. Micro-images in the lensing-dominated regime. The black dots mark stellar masses. The gray curves show the arrival-time contours. Ellipses show micro-images (blue for minima, and red for saddle points). Right. Autocorrelation signals are shown in blue for the real part and in magenta for the imaginary part. A tanh activation function has been applied to reduce the contrast between the lines.
Current usage metrics show cumulative count of Article Views (full-text article views including HTML views, PDF and ePub downloads, according to the available data) and Abstracts Views on Vision4Press platform.
Data correspond to usage on the plateform after 2015. The current usage metrics is available 48-96 hours after online publication and is updated daily on week days.
Initial download of the metrics may take a while.