Fig. 3.
Download original image
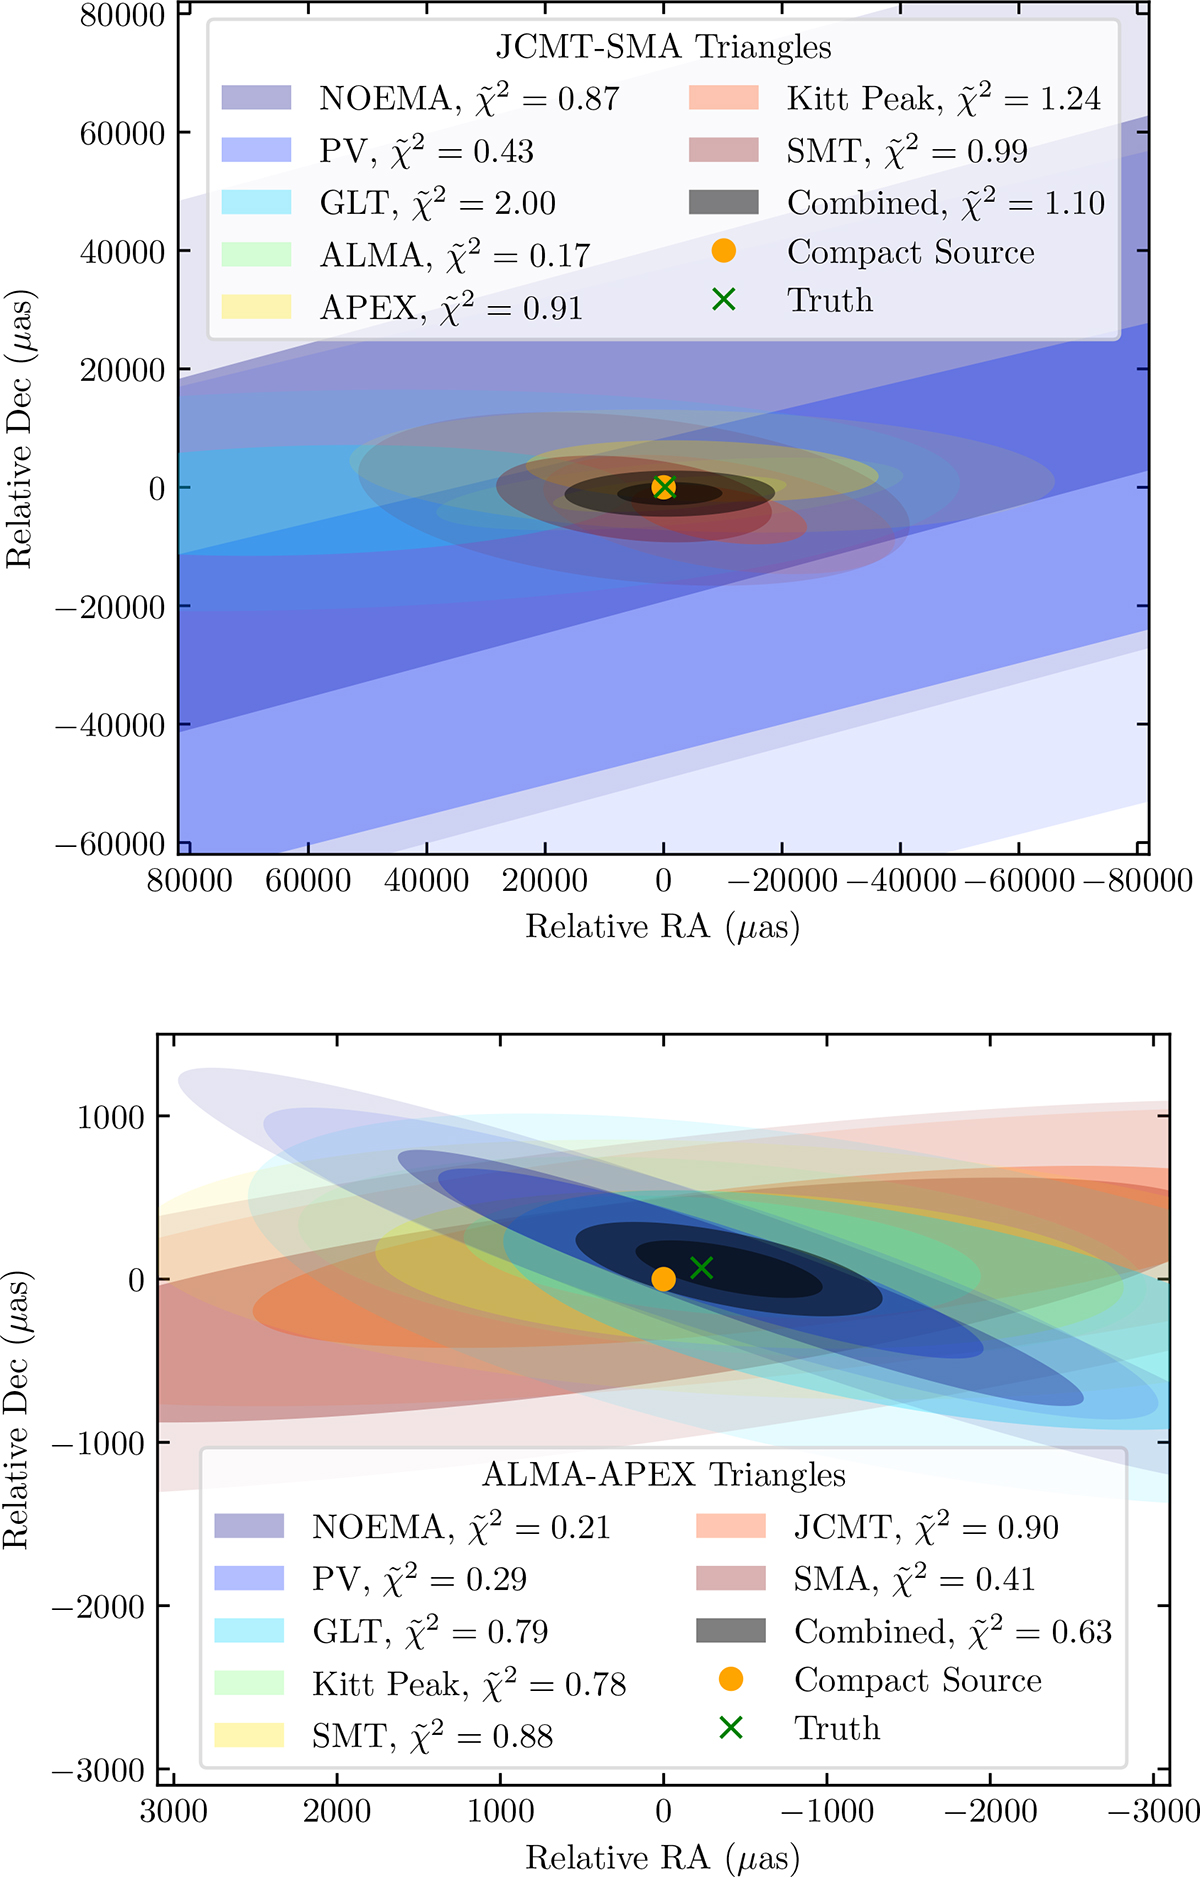
Covariance ellipses for the fits of the centroid position offset measured from synthetic data. The top panel shows triangles involving JCMT and SMA, while the bottom panel shows triangles involving ALMA and APEX. The black ellipses shows the two-dimensional 68% and 95% confidence region from fits over the entire dataset, while all other colors split up the data into separate triangles. The orange dot is the phase reference, which is assumed to coincide with the compact ring, and the green x is the truth, with the same coordinates as in Figure 1. Stations are colored east to west (blue to red), which roughly corresponds to the short baseline rotating over the course of a night. The reduced chi-squared statistic ![]() characterizes the goodness of fit and is defined in Appendix D. The bottom panel is zoomed relative to the top.
characterizes the goodness of fit and is defined in Appendix D. The bottom panel is zoomed relative to the top.
Current usage metrics show cumulative count of Article Views (full-text article views including HTML views, PDF and ePub downloads, according to the available data) and Abstracts Views on Vision4Press platform.
Data correspond to usage on the plateform after 2015. The current usage metrics is available 48-96 hours after online publication and is updated daily on week days.
Initial download of the metrics may take a while.