Fig. 6.
Download original image
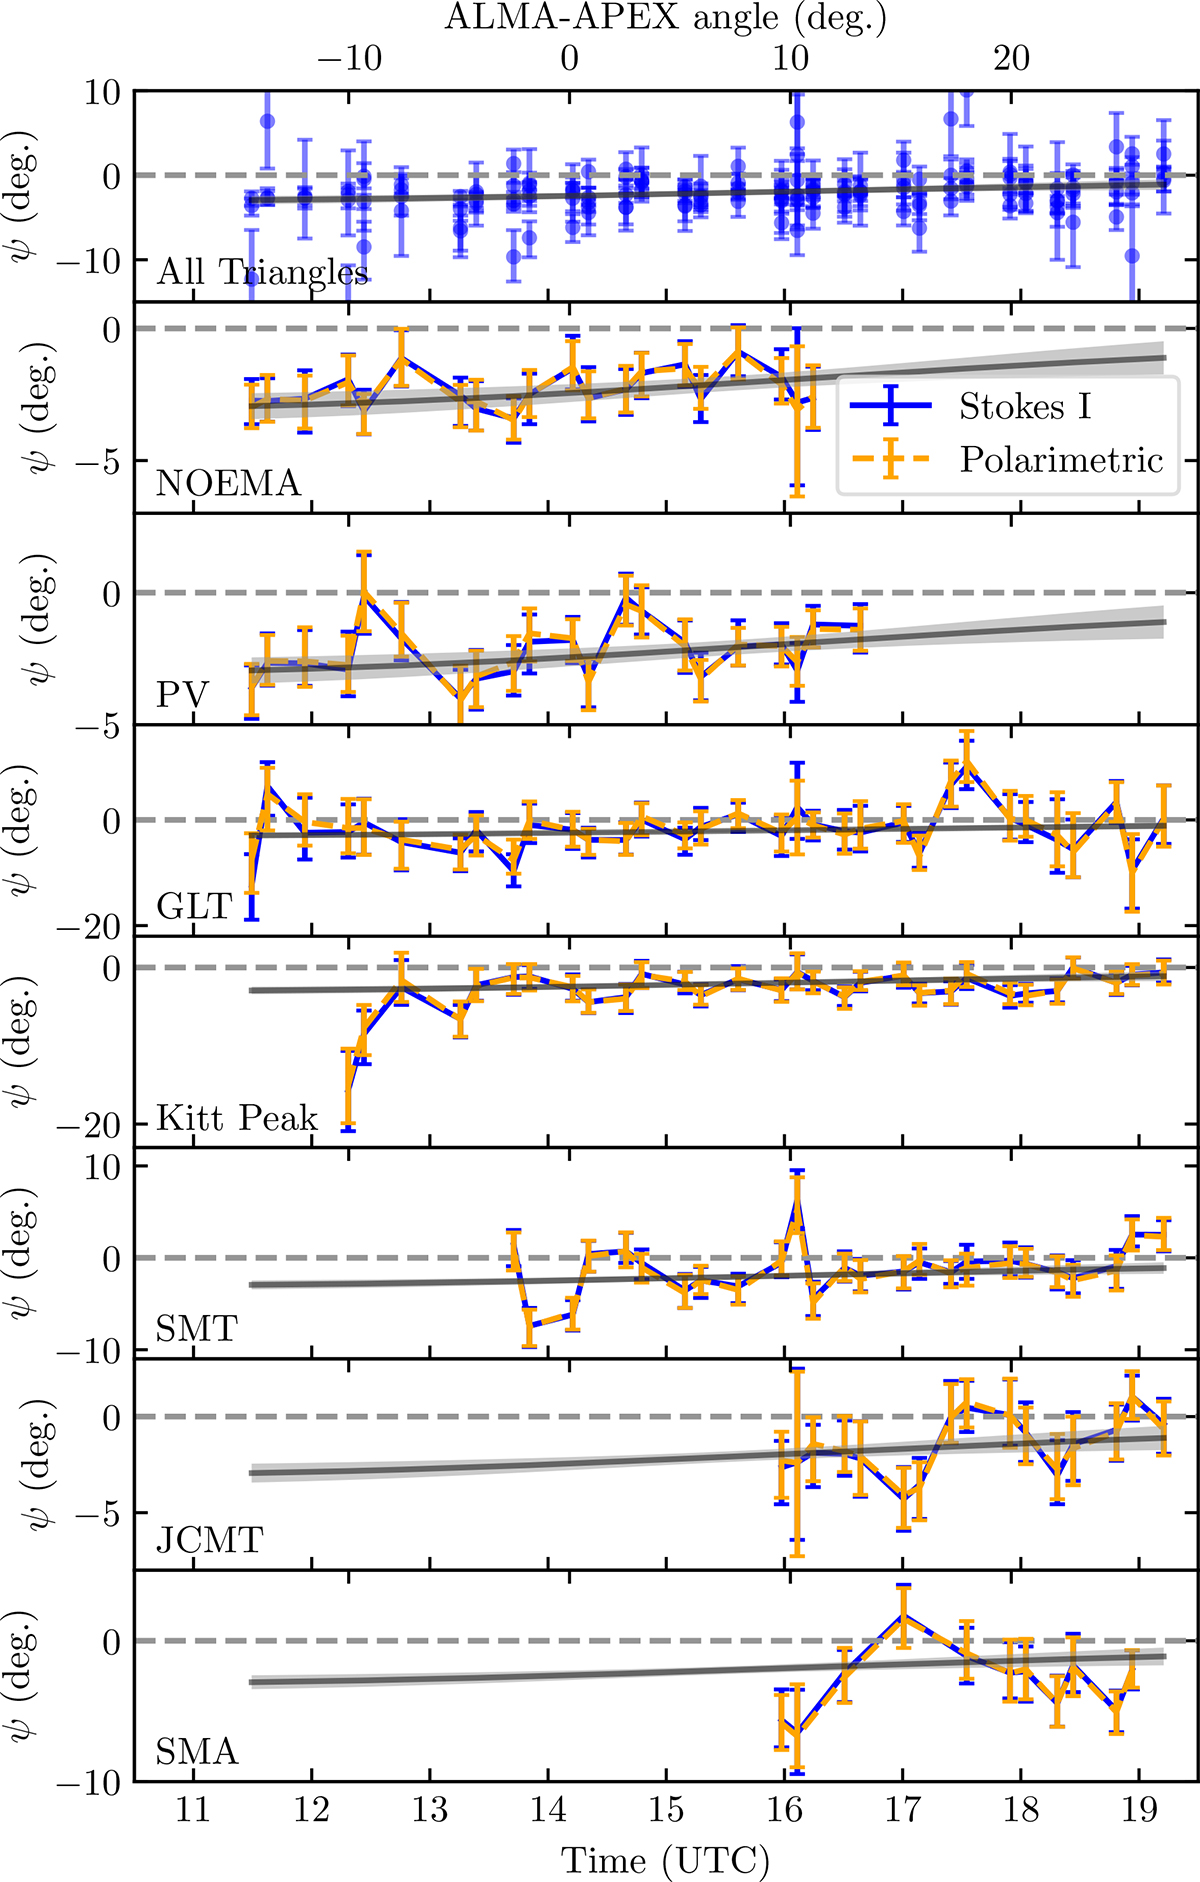
Closure phases on ALMA-APEX triangles from EHT 2021 April 18 data in band 3. The top panel shows all triangles and the other panels separate out each triangle. Stokes I closure phases are in blue and polarimetric closure phases are in orange. The black line and gray shaded region show the mean and 95% fit region corresponding to Figure 5. The closure phases are offset from zero, consistently with one another, and match the linear fit well. The top ticks convert time to the ALMA-APEX baseline direction measured east of north.
Current usage metrics show cumulative count of Article Views (full-text article views including HTML views, PDF and ePub downloads, according to the available data) and Abstracts Views on Vision4Press platform.
Data correspond to usage on the plateform after 2015. The current usage metrics is available 48-96 hours after online publication and is updated daily on week days.
Initial download of the metrics may take a while.