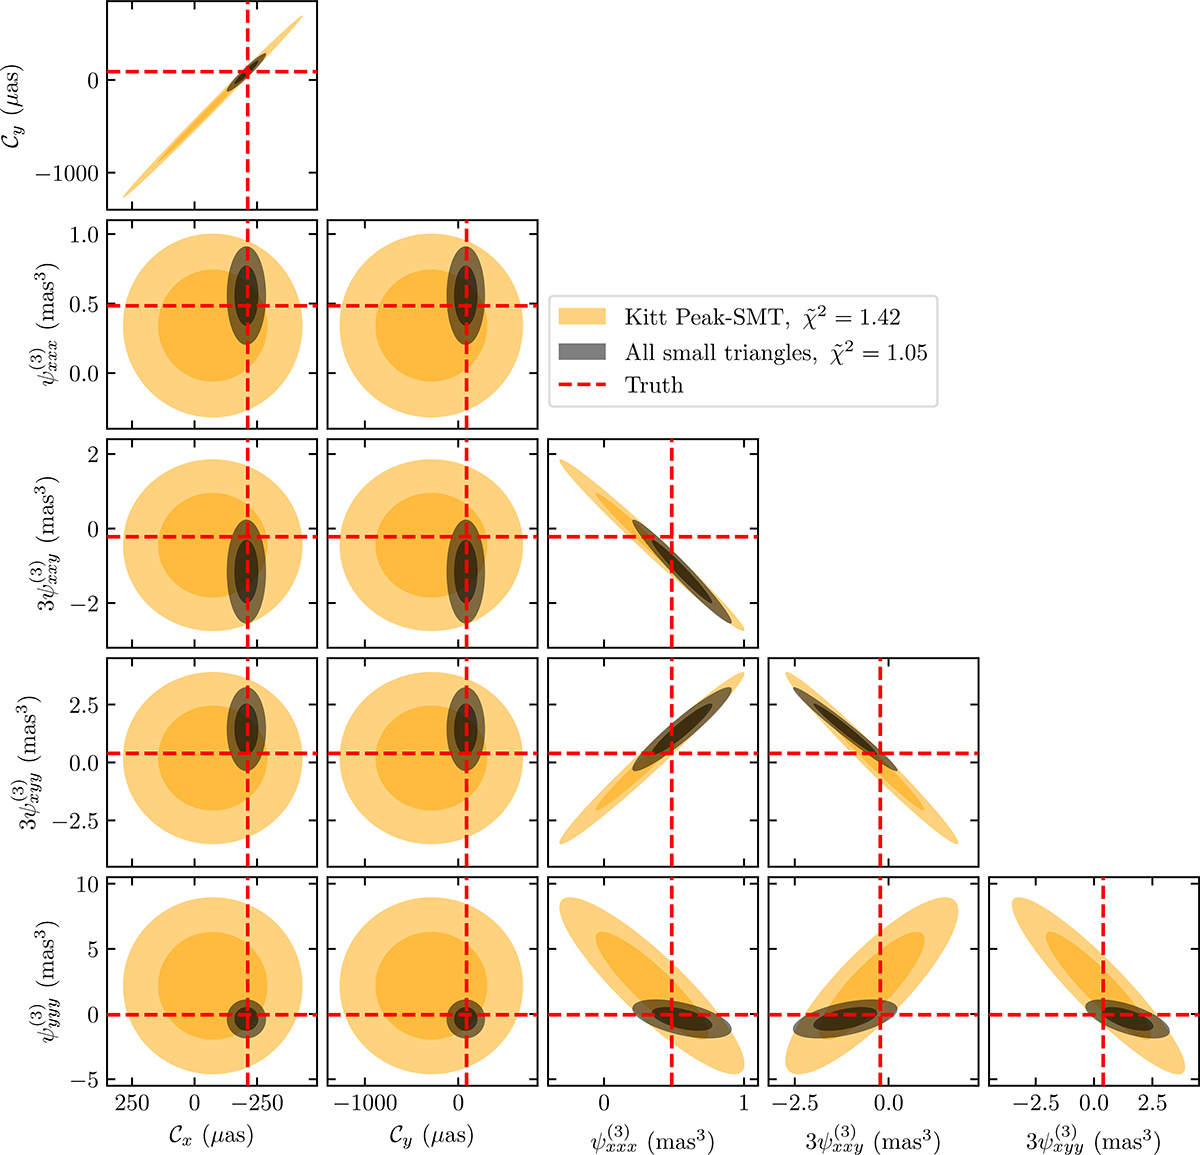
Fig. C.1.
Download original image
Two-dimensional 68% and 95% confidence regions of the third-order fits to the synthetic data set closure phases. Orange regions correspond to including only triangles with Kitt Peak-SMT and black regions include ALMA-APEX and JCMT-SMA triangles as well. Dashed red lines show the truth values measured with Equation C.1. The truths are not recovered for all parameter combinations.
Current usage metrics show cumulative count of Article Views (full-text article views including HTML views, PDF and ePub downloads, according to the available data) and Abstracts Views on Vision4Press platform.
Data correspond to usage on the plateform after 2015. The current usage metrics is available 48-96 hours after online publication and is updated daily on week days.
Initial download of the metrics may take a while.