Fig. 2.
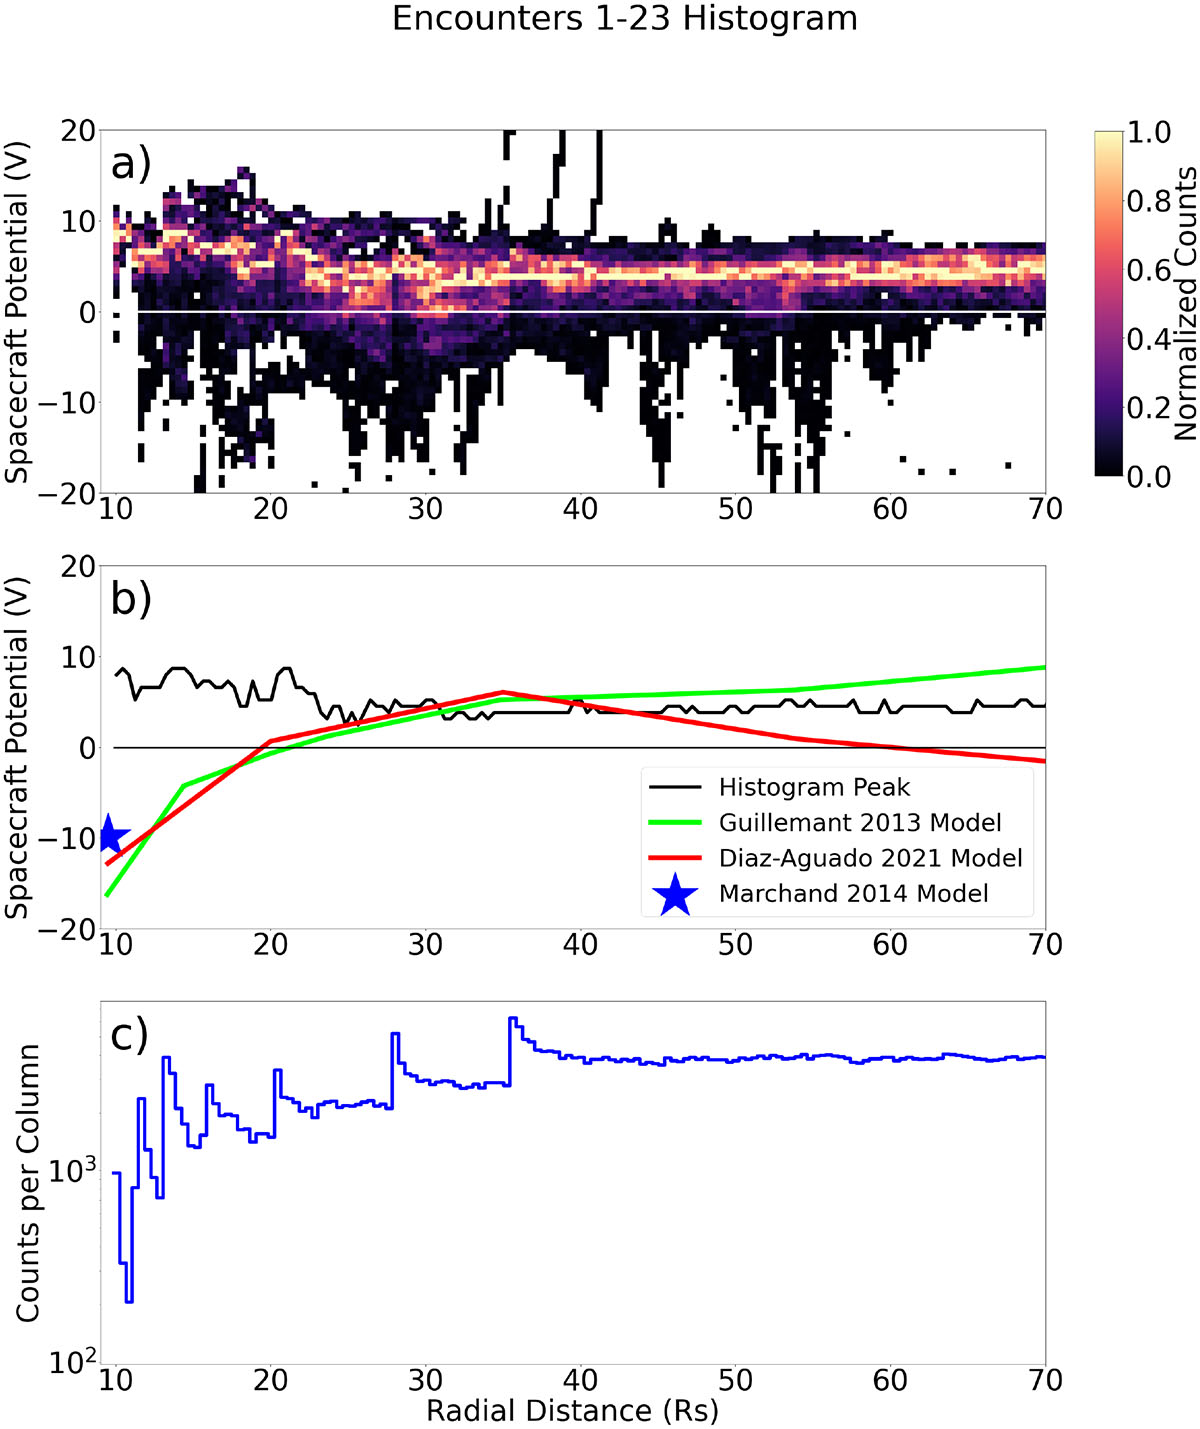
Download original image
(a) Two-dimensional histogram of the spacecraft floating potential as a function of radial distance (in solar radii, RS) from the Sun. Each radial distance bin of the histogram is normalized by the maximum of its distribution. (b) Voltage corresponding to the peak counts in each radial bin are plotted against radial distance (black). Spacecraft charging model predictions (green, red, blue star) are overplotted for comparison. (c) Number of data samples per radial distance bin of the two-dimensional histogram.
Current usage metrics show cumulative count of Article Views (full-text article views including HTML views, PDF and ePub downloads, according to the available data) and Abstracts Views on Vision4Press platform.
Data correspond to usage on the plateform after 2015. The current usage metrics is available 48-96 hours after online publication and is updated daily on week days.
Initial download of the metrics may take a while.