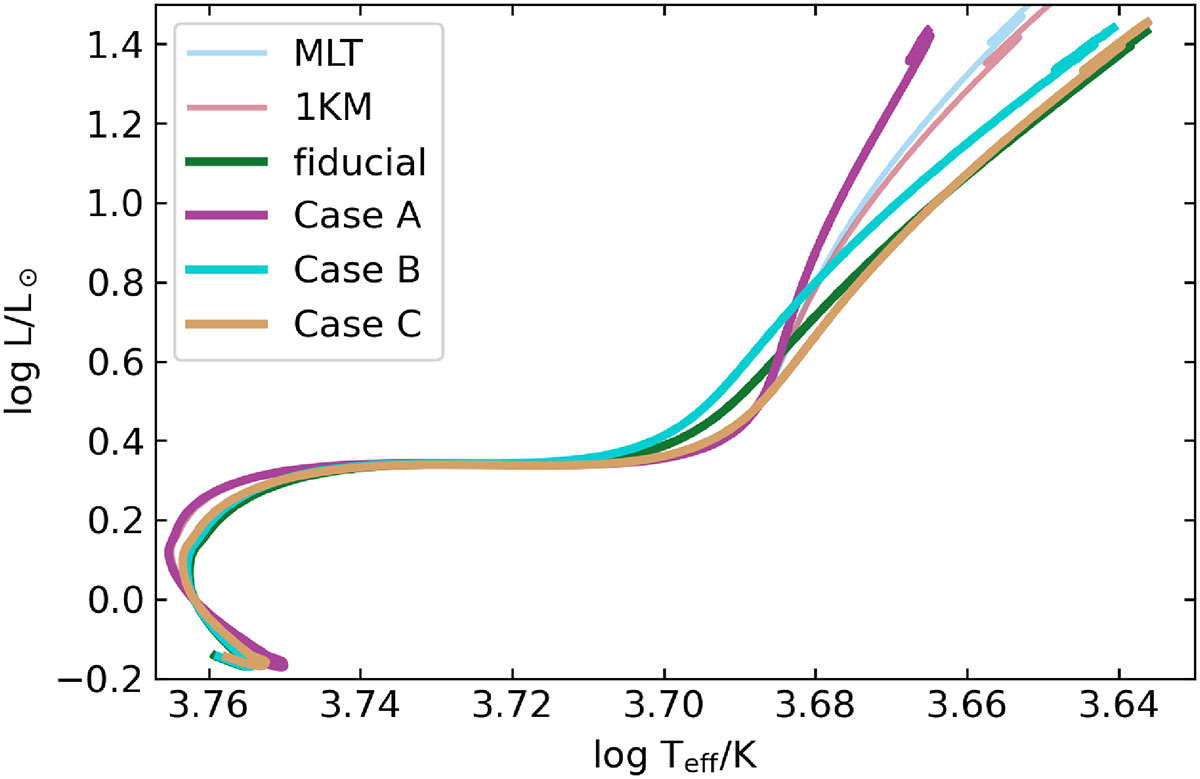
Fig. 12.
Download original image
Hertzsprung-Russel diagram showing the evolution of the solar models. The models using MLT and the 1KM are shown in thin light blue and light pink lines for comparison. The different treatment of the outer layers for the models with 3KM results in higher (Case A: purple) and lower (fully non-local: green; Case B: turquoise; Case C: orange) effective temperatures on the RGB compared to MLT and 1KM.
Current usage metrics show cumulative count of Article Views (full-text article views including HTML views, PDF and ePub downloads, according to the available data) and Abstracts Views on Vision4Press platform.
Data correspond to usage on the plateform after 2015. The current usage metrics is available 48-96 hours after online publication and is updated daily on week days.
Initial download of the metrics may take a while.