Fig. 7.
Download original image
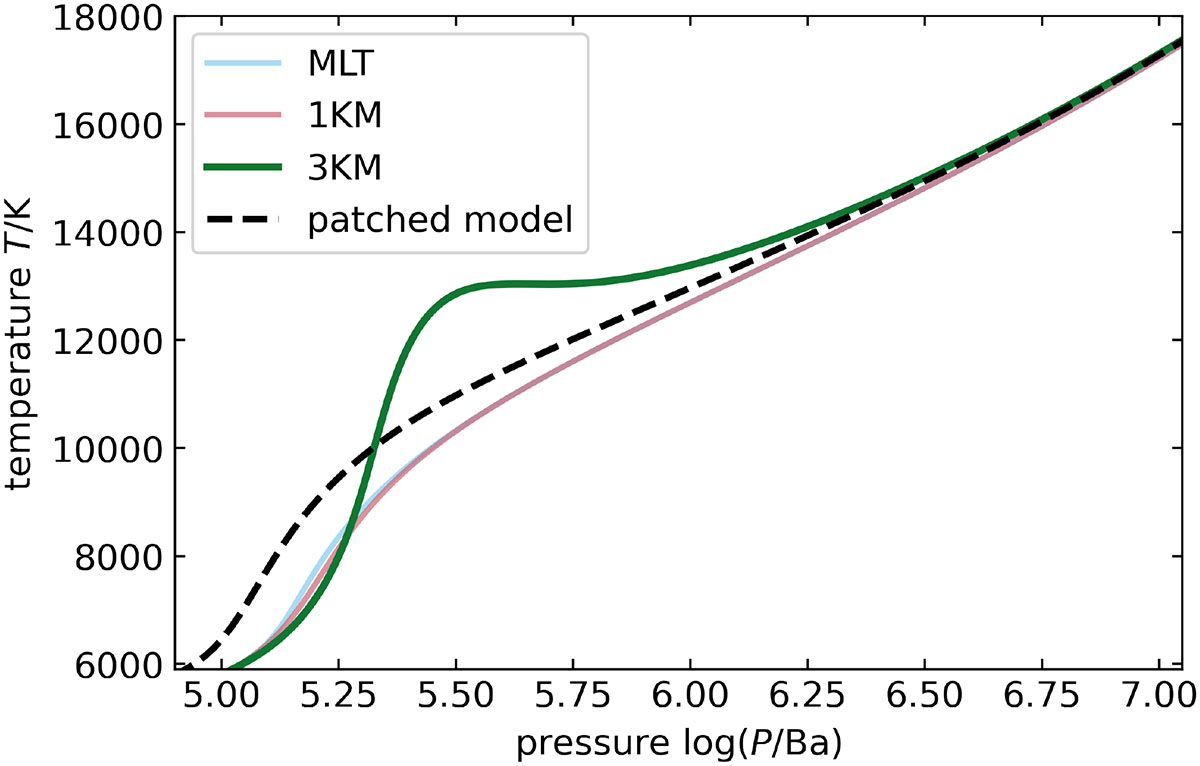
Pressure against temperature in the uppermost regions. The light pink line shows the profile for SSM-1KM, which largely overlaps the light blue line showing the SSM-MLT. The dashed black line shows the profile of the solar model using an averaged 3D atmosphere as the outer boundary condition (“patched model”, Jørgensen & Weiss 2019). SSM-3KM is represented by the green line. The segment corresponds to the outermost 0.0026 R⊙.
Current usage metrics show cumulative count of Article Views (full-text article views including HTML views, PDF and ePub downloads, according to the available data) and Abstracts Views on Vision4Press platform.
Data correspond to usage on the plateform after 2015. The current usage metrics is available 48-96 hours after online publication and is updated daily on week days.
Initial download of the metrics may take a while.