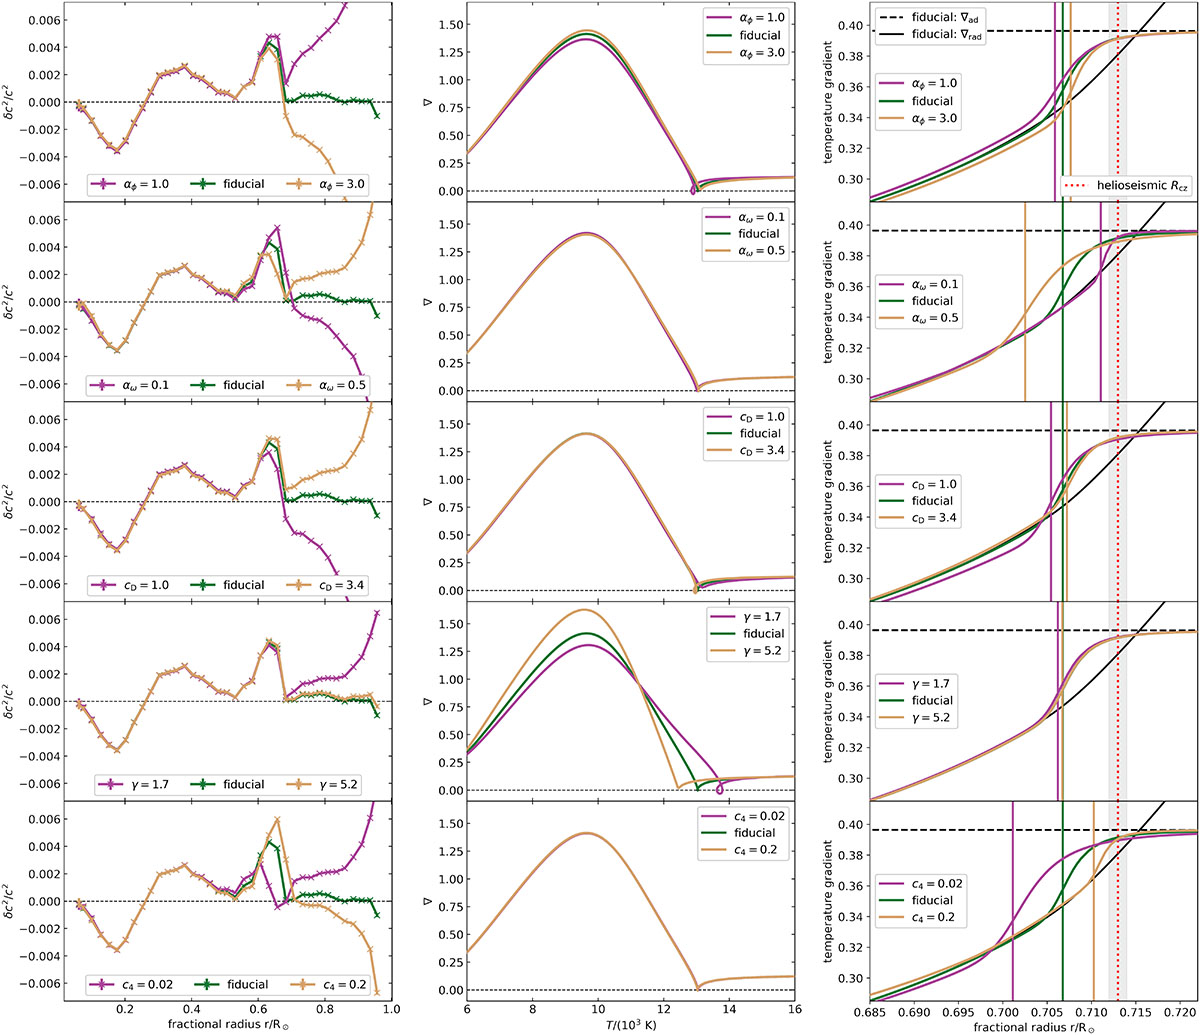
Fig. 8.
Download original image
Solar models obtained with the 3KM and different sets of free parameters (see Table 1). From left to right, the panels show the difference of the sound speed profile between models and observations, the temperature stratification of the outer layers, and the temperature stratification at the inner boundary of the convective envelope. The vertical lines in the right panels denote the radius at which the change of the slope in the profile of the temperature gradient is strongest. The dotted red line denotes the helioseimisc measurement, with the 1σ ranges indicated by the grey shaded regions.
Current usage metrics show cumulative count of Article Views (full-text article views including HTML views, PDF and ePub downloads, according to the available data) and Abstracts Views on Vision4Press platform.
Data correspond to usage on the plateform after 2015. The current usage metrics is available 48-96 hours after online publication and is updated daily on week days.
Initial download of the metrics may take a while.