Fig. 9.
Download original image
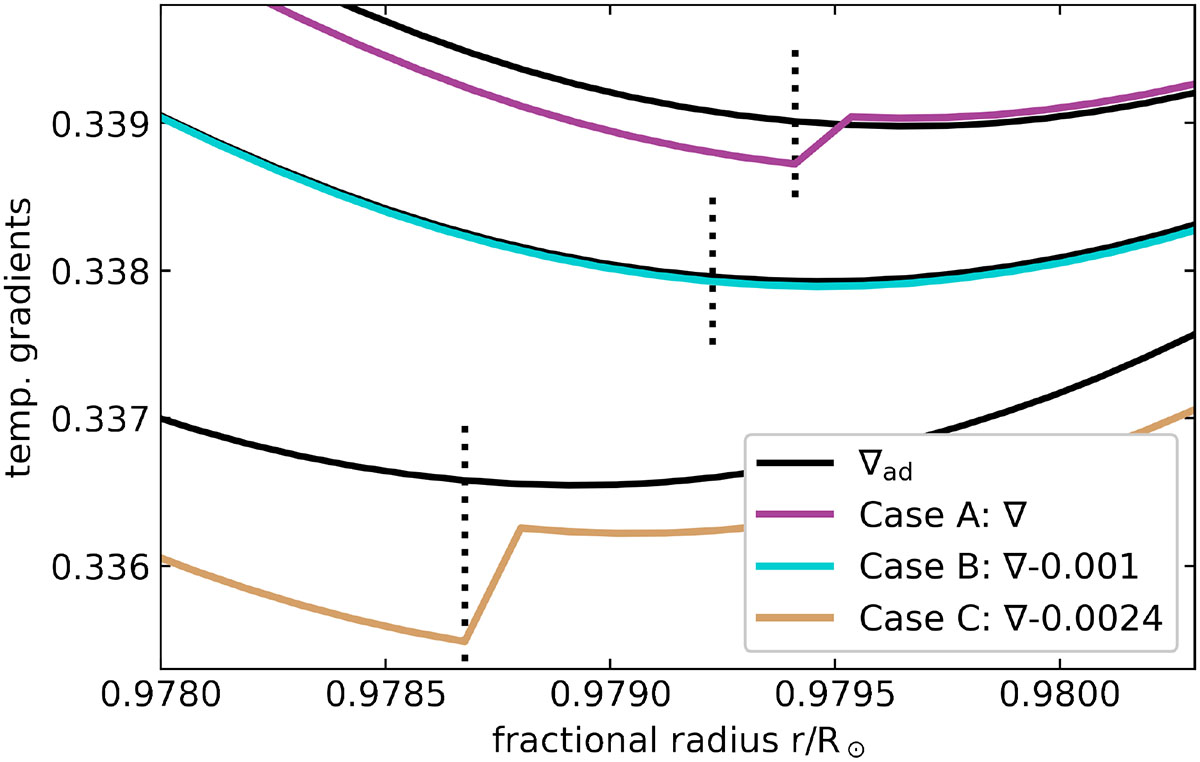
Radius at which the models switch to the local closure relations for the outer regions. Case A is shown in purple. For better visibility, case B (turquoise) and case C (orange) are shifted by –0.001 and –0.0024, respectively (see Table 2). The black lines show ∇ad of the different models, shifted by the same amount as the model ∇. The dotted vertical lines mark the last grid point at which the fully non-local 3KM was applied.
Current usage metrics show cumulative count of Article Views (full-text article views including HTML views, PDF and ePub downloads, according to the available data) and Abstracts Views on Vision4Press platform.
Data correspond to usage on the plateform after 2015. The current usage metrics is available 48-96 hours after online publication and is updated daily on week days.
Initial download of the metrics may take a while.