Fig. 11
Download original image
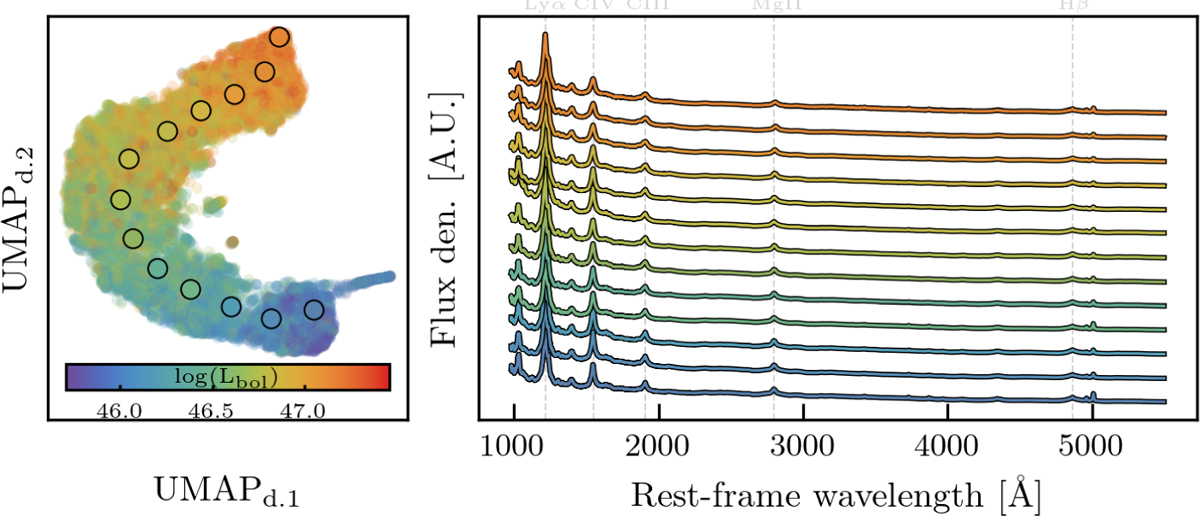
UMAP representation colour-coded as a function of the bolometric luminosity and the resulting spectra decoded from the latent space point in the direction of evolution. Left panel: UMAP embedding; the points on which we applied the inverse UMAP transformation are highlighted as scatter points and are colour-coded using the average neighbouring colour. Right panel: Spectra decoded from latent space samples highlighted in the left panel and colour-coded according to the respective originating scatter point.
Current usage metrics show cumulative count of Article Views (full-text article views including HTML views, PDF and ePub downloads, according to the available data) and Abstracts Views on Vision4Press platform.
Data correspond to usage on the plateform after 2015. The current usage metrics is available 48-96 hours after online publication and is updated daily on week days.
Initial download of the metrics may take a while.