Fig. 15
Download original image
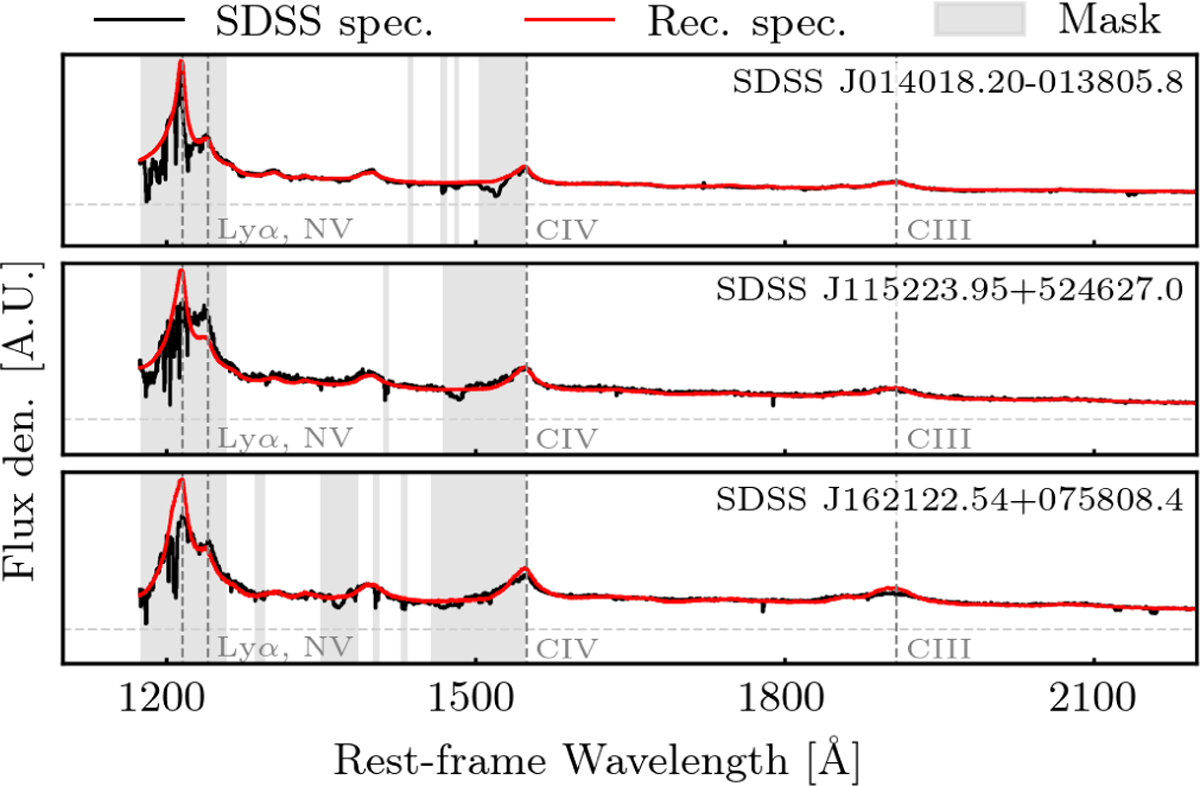
Example of a spectrum with an acceptable reconstruction (top panel), a spectrum for which the model underestimates the Lyman-α and N V complex (middle panel), and a spectrum for which instead the restframe UV and optical emission lines are not well reproduced (bottom panel). We show in black the input spectrum, in red the reconstruction, and with the shaded grey areas the masked out regions. We show the remaining spectra in Fig. F.1.
Current usage metrics show cumulative count of Article Views (full-text article views including HTML views, PDF and ePub downloads, according to the available data) and Abstracts Views on Vision4Press platform.
Data correspond to usage on the plateform after 2015. The current usage metrics is available 48-96 hours after online publication and is updated daily on week days.
Initial download of the metrics may take a while.