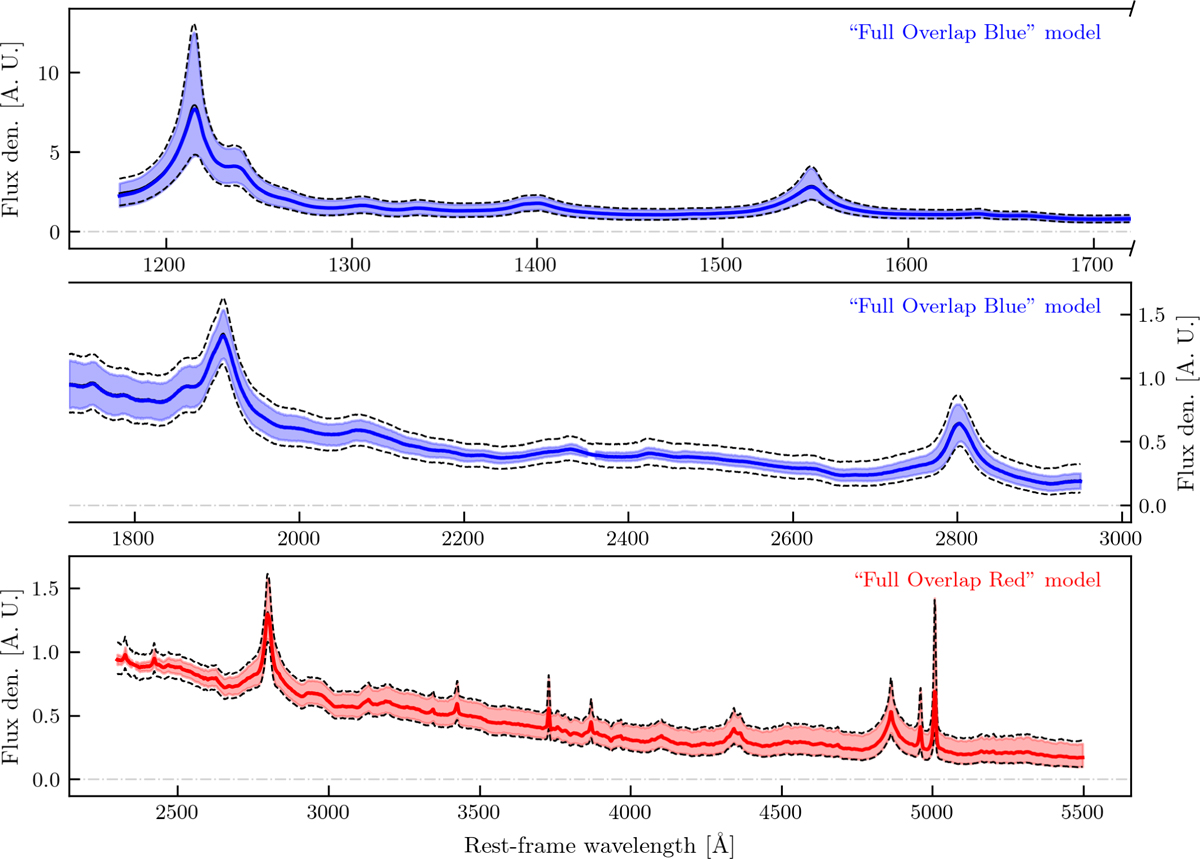
Fig. B.1
Download original image
Sampled spectra from the FOR and FOB models compared to the input spectra. In all panels, the black solid and dashed lines indicate the median, 16th and 84th percentile of the input data. The solid grey line represents the median spectrum of 10 000 realisations sampled from the VAE, while the shaded area encompasses the 16th and 84th percentile of the same sampled data.
Current usage metrics show cumulative count of Article Views (full-text article views including HTML views, PDF and ePub downloads, according to the available data) and Abstracts Views on Vision4Press platform.
Data correspond to usage on the plateform after 2015. The current usage metrics is available 48-96 hours after online publication and is updated daily on week days.
Initial download of the metrics may take a while.