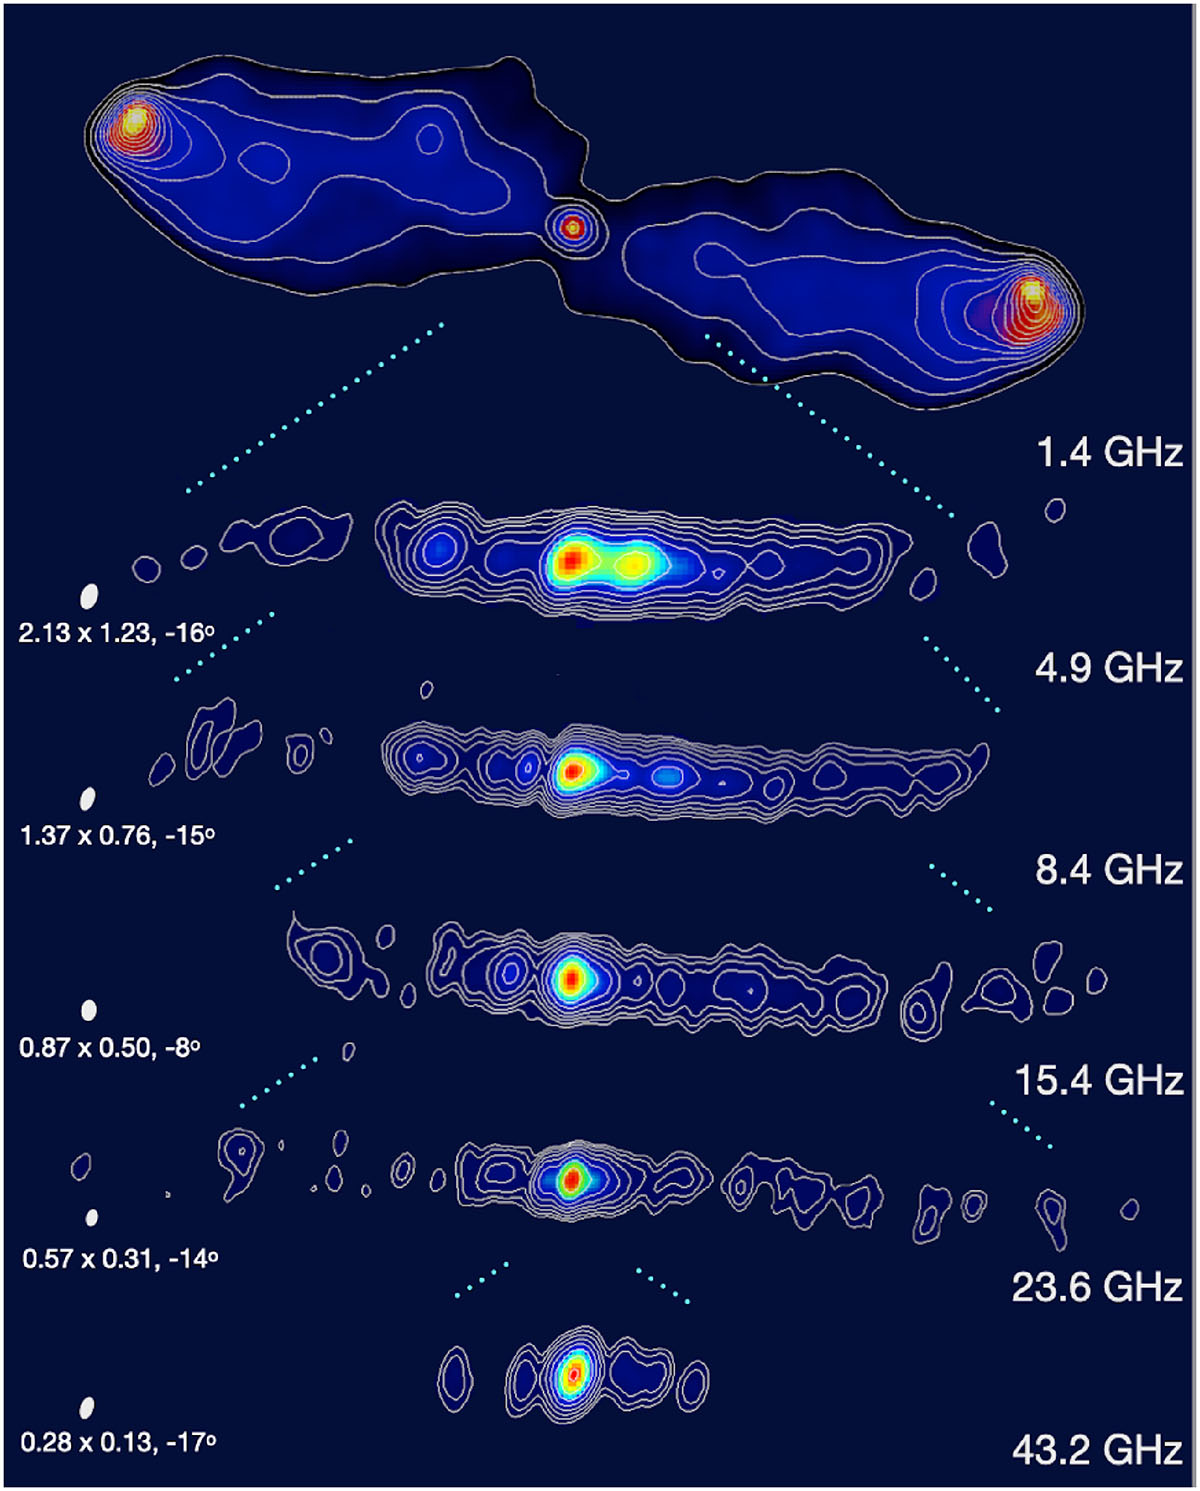
Fig. 1.
Download original image
Twin-jet structure of 3C 452 from kiloparsec to sub-parsec scales. The top image was obtained from VLA data at 1.4 GHz (Leahy et al. 1996). The following maps show the VLBI structure at different frequencies (4.9 GHz, 8.4 GHz, 15.4 GHz, 23.6 GHz, 43.2 GHz) based on the analyzed data of our project code BM516B presented in Sect. 2. Images were produced using natural weighting. The maps have been aligned to the central brightest feature. The complete series of images considered in the article is presented in the Appendix A.
Current usage metrics show cumulative count of Article Views (full-text article views including HTML views, PDF and ePub downloads, according to the available data) and Abstracts Views on Vision4Press platform.
Data correspond to usage on the plateform after 2015. The current usage metrics is available 48-96 hours after online publication and is updated daily on week days.
Initial download of the metrics may take a while.