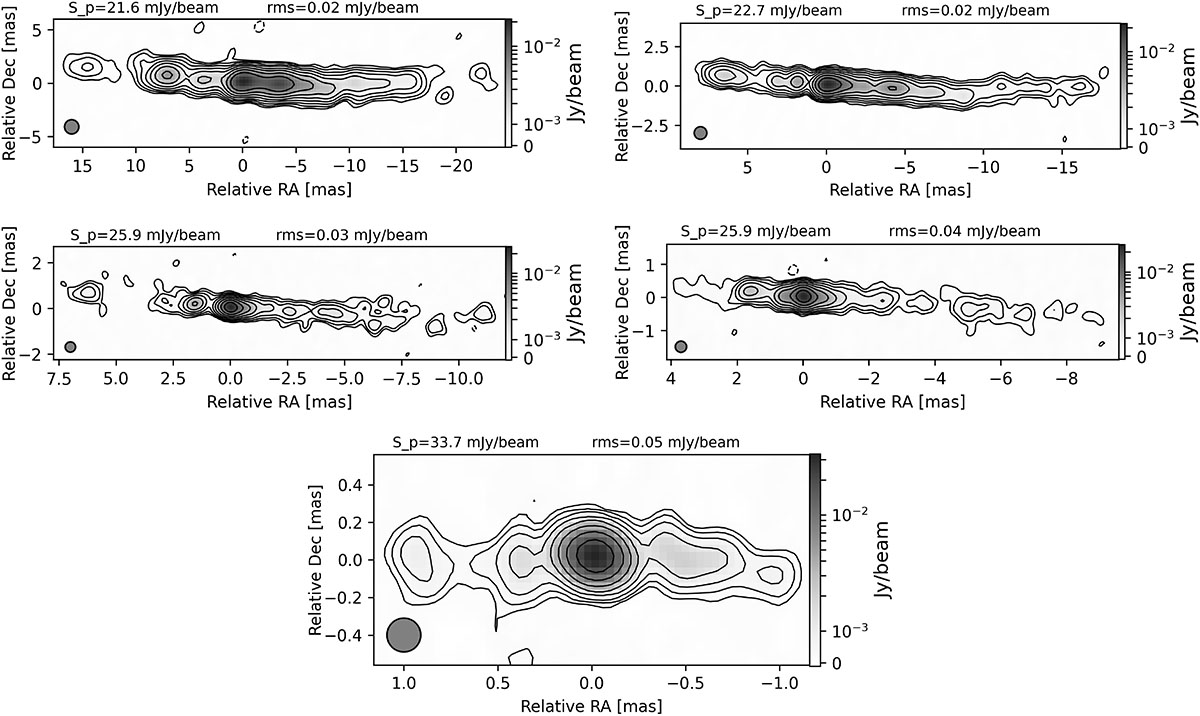
Fig. 2.
Download original image
Stacked VLBI images of 3C 452 at 4.9 (upper left), 8.4 (upper right), 15.4 (middle left), 23.6 (middle right), and 43.2 (bottom) GHz. The images were restored with circular beams of 1.48, 0.8, 0.45, 0.34, and 0.18 mas, respectively. The respective peak flux density and rms values are displayed at the top of each panel. The maps were produced using uniform weighting.
Current usage metrics show cumulative count of Article Views (full-text article views including HTML views, PDF and ePub downloads, according to the available data) and Abstracts Views on Vision4Press platform.
Data correspond to usage on the plateform after 2015. The current usage metrics is available 48-96 hours after online publication and is updated daily on week days.
Initial download of the metrics may take a while.