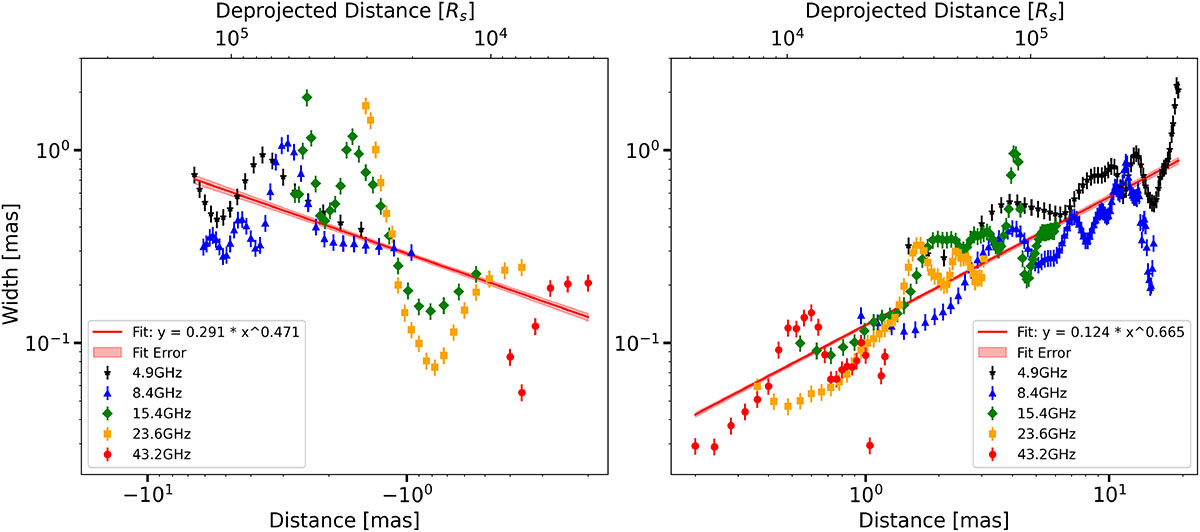
Fig. 6.
Download original image
Jet collimation profile of the receding counter-jet (left) and approaching jet (right) derived from stacked images at all frequencies using pixel-by-pixel analysis. The jet width is plotted as a function of distance from the common reference frame. Power-law fits (solid red lines) indicate a parabolic expansion for both sides, with indices k = 0.47 ± 0.01 (counter-jet) and k = 0.66 ± 0.01 (jet), consistent with magnetically collimated flows.
Current usage metrics show cumulative count of Article Views (full-text article views including HTML views, PDF and ePub downloads, according to the available data) and Abstracts Views on Vision4Press platform.
Data correspond to usage on the plateform after 2015. The current usage metrics is available 48-96 hours after online publication and is updated daily on week days.
Initial download of the metrics may take a while.