Fig. 8.
Download original image
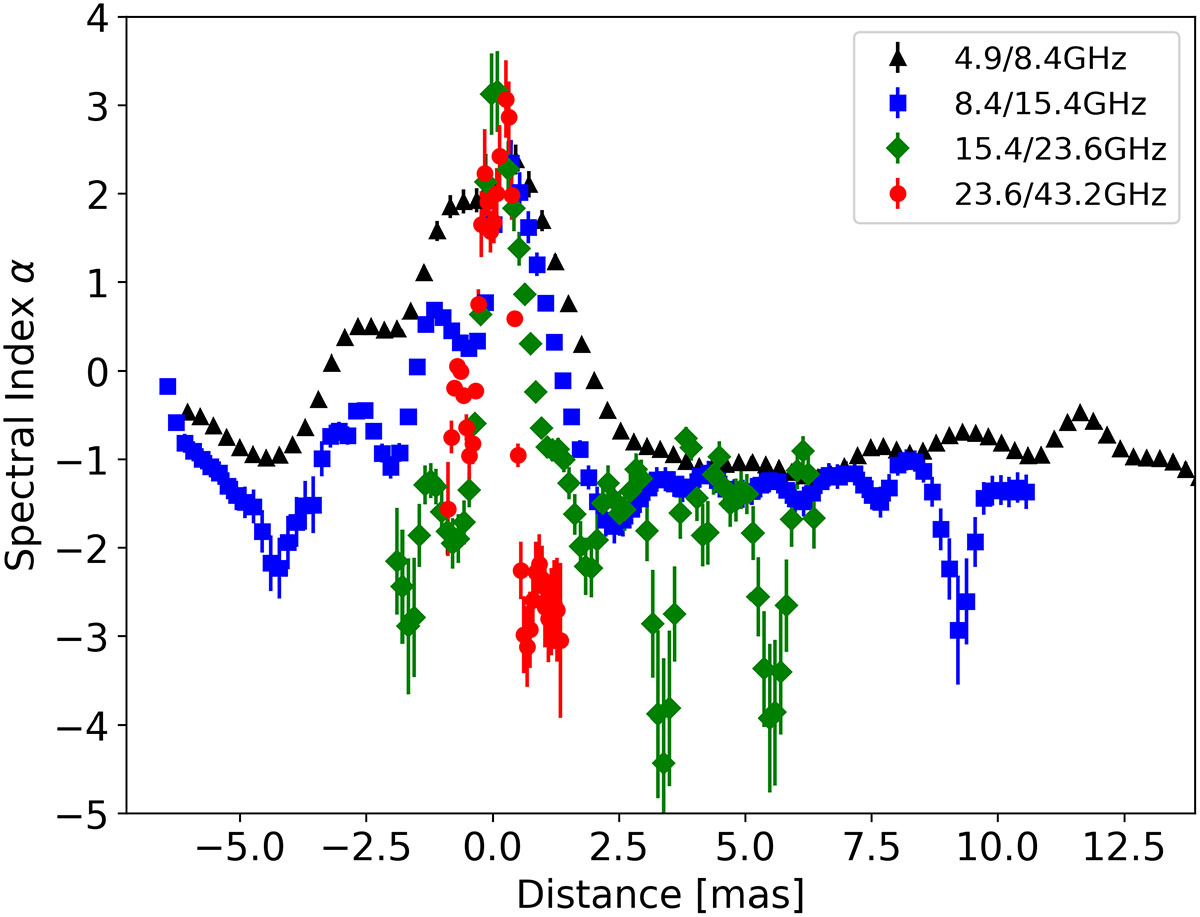
Spectral index profile (α) along the jet ridge line of 3C 452 measured from four frequency pairs 4.9/8.4 GHz (black triangles), 8.4/15.4 GHz (blue squares), 15.4/23.6 GHz (green diamonds), and 23.6/43.2 GHz (red circles). The horizontal axis shows the projected distance in milliarcseconds from the common reference frame, and the vertical axis shows the spectral index computed via Sν ∝ να. The central region (within ∼2 mas) displays strongly inverted spectra (α > 2), which are indicative of synchrotron self-absorption, while downstream values turn negative, consistent with optically thin synchrotron emission. The peak in the spectral index near 0 mas supports the adopted reference position of the black hole.
Current usage metrics show cumulative count of Article Views (full-text article views including HTML views, PDF and ePub downloads, according to the available data) and Abstracts Views on Vision4Press platform.
Data correspond to usage on the plateform after 2015. The current usage metrics is available 48-96 hours after online publication and is updated daily on week days.
Initial download of the metrics may take a while.