Fig. 9.
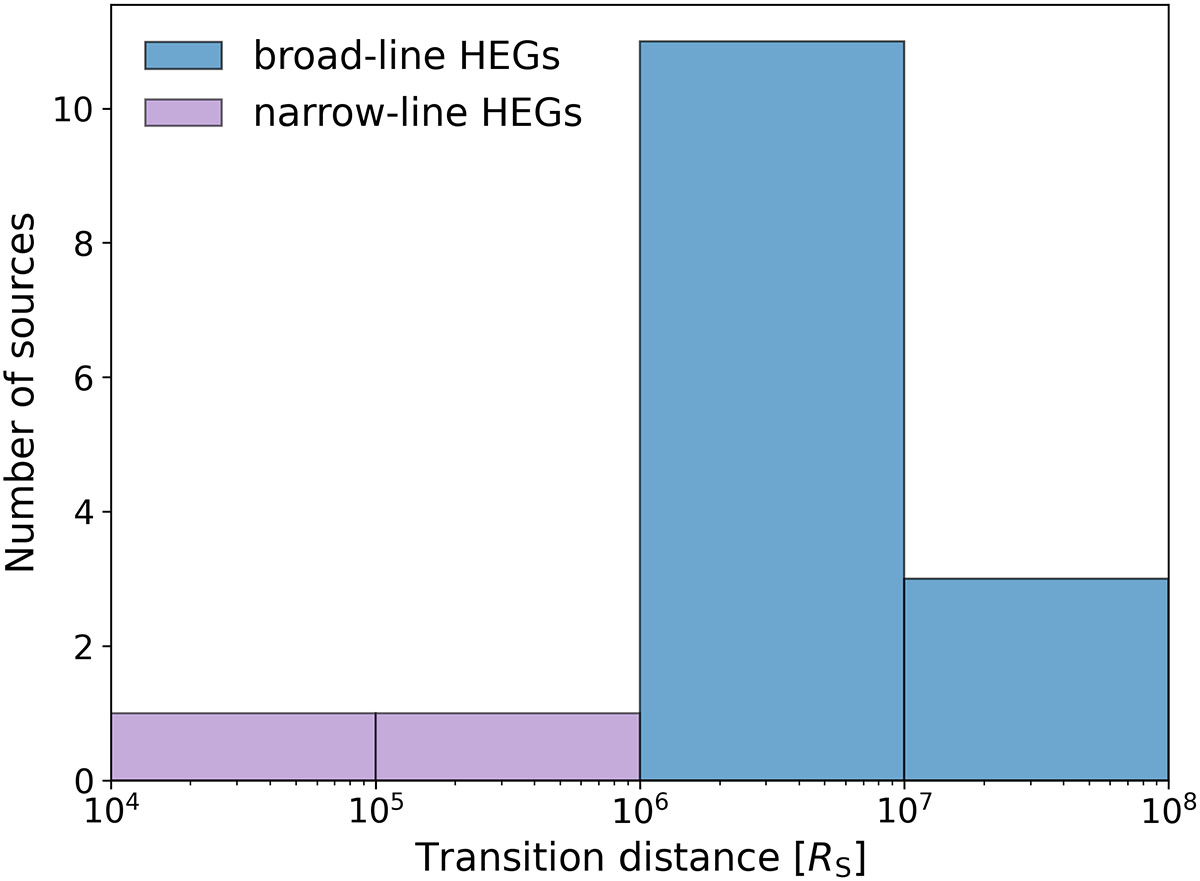
Download original image
Distribution of the de-projected transition distances in HEGs, expressed in units of Schwarzschild radii (RS). Data were compiled from Boccardi et al. (2021), Algaba et al. (2019), Traianou et al. (2020), Okino et al. (2022), Burd et al. (2022), Yi et al. (2024), Shang et al. (2025) and also include 3C 452. Narrow-line HEGs (Cygnus A and 3C 452) are plotted in purple, while broad-line HEGs are shown in blue.
Current usage metrics show cumulative count of Article Views (full-text article views including HTML views, PDF and ePub downloads, according to the available data) and Abstracts Views on Vision4Press platform.
Data correspond to usage on the plateform after 2015. The current usage metrics is available 48-96 hours after online publication and is updated daily on week days.
Initial download of the metrics may take a while.