Open Access
Fig. 2.
Download original image
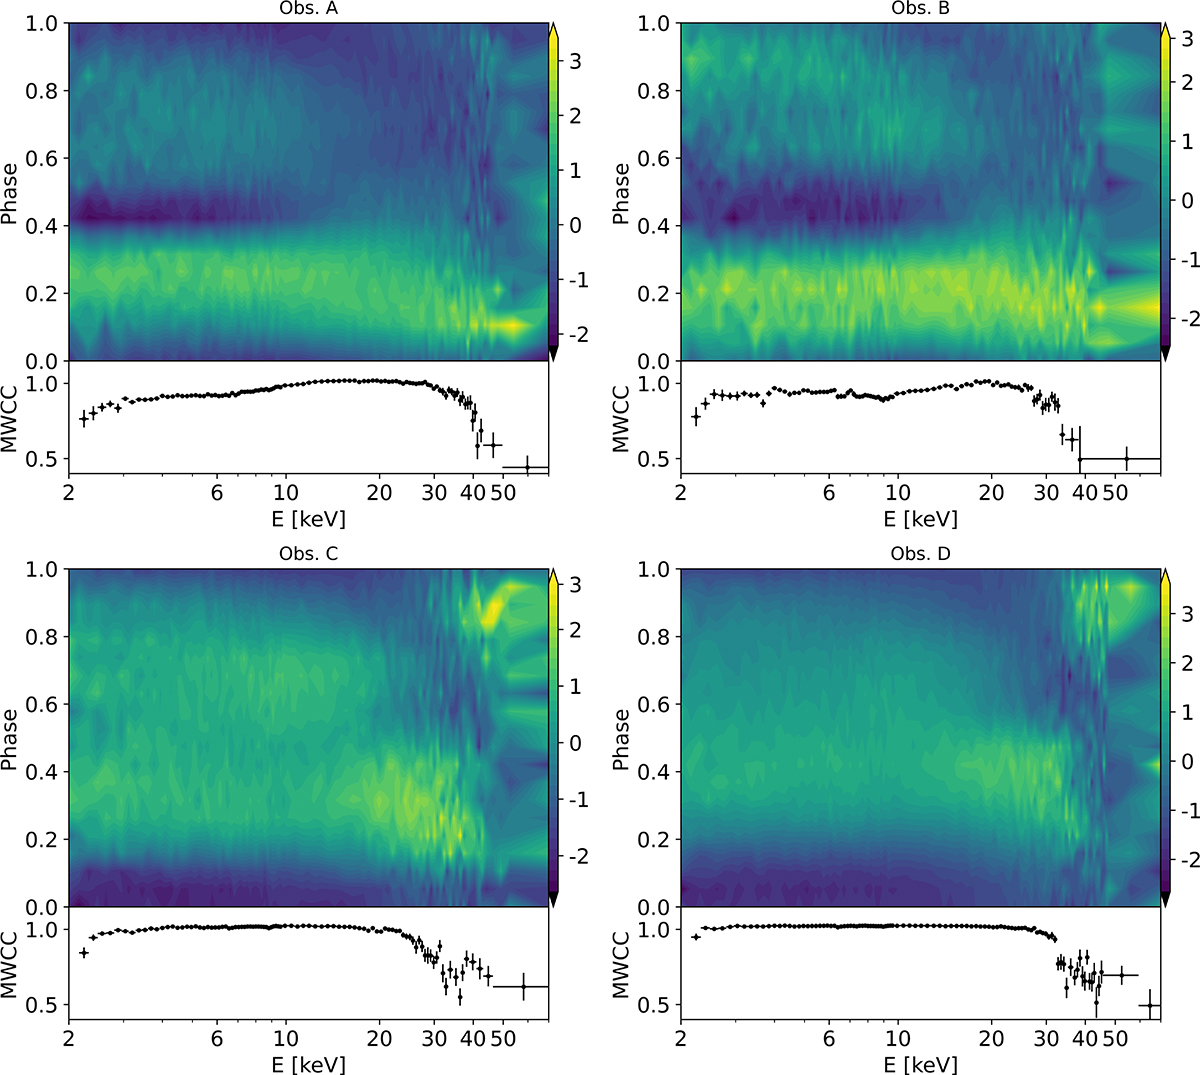
Energy-phase maps and MWCC with a window of two adjacent bins (see text). For each panel, we chose Nbins = 20 and S/N = 5.0. The colour bar, on the right side of each map, represents the values of the normalised profiles plotted in the map and spans between the minimum and the maximum of the entire map.
Current usage metrics show cumulative count of Article Views (full-text article views including HTML views, PDF and ePub downloads, according to the available data) and Abstracts Views on Vision4Press platform.
Data correspond to usage on the plateform after 2015. The current usage metrics is available 48-96 hours after online publication and is updated daily on week days.
Initial download of the metrics may take a while.