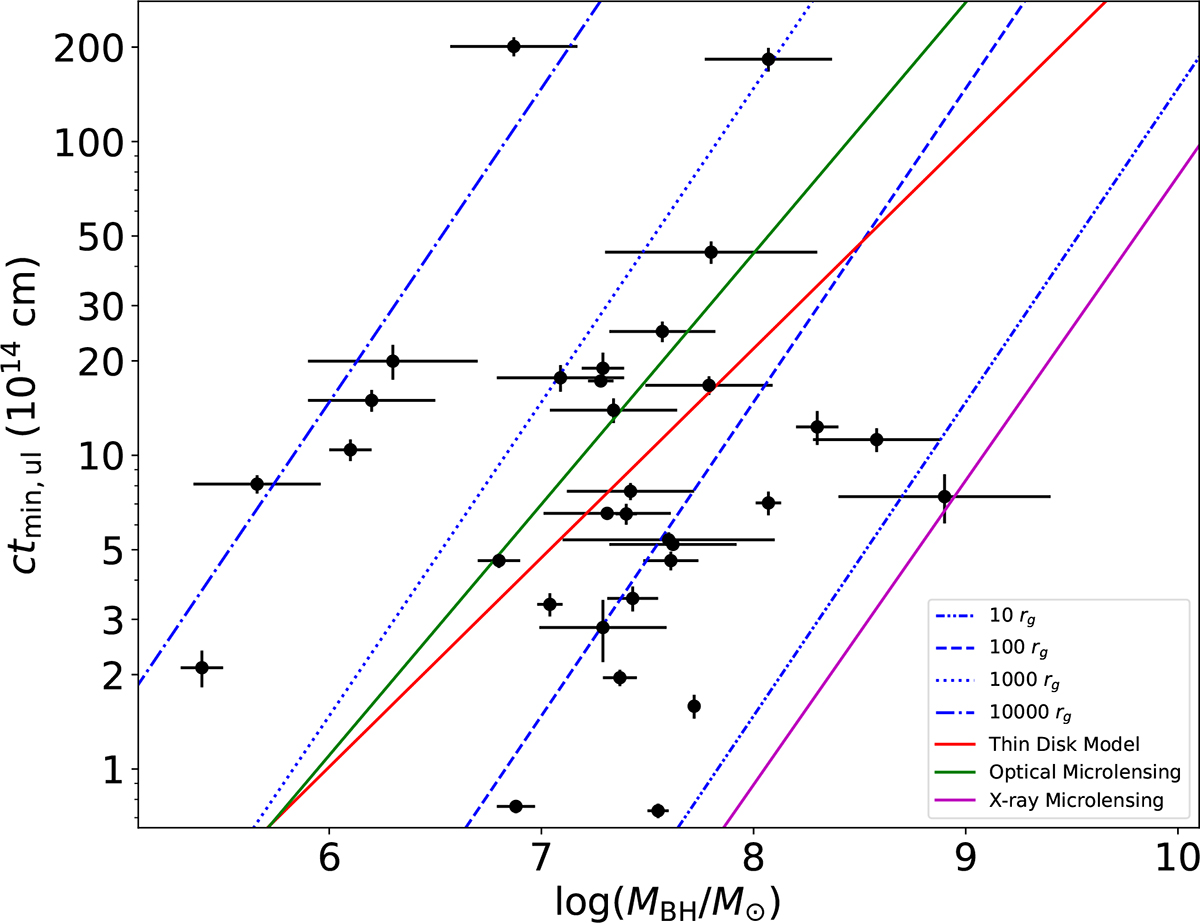
Fig. 4.
Download original image
Distribution of the shortest detected TESS variability timescales of the sample, plotted against the black hole mass. The blue dashed lines indicate the different values of gravitational radii for the given black hole mass, and the green and red solid lines indicate the theoretical and measured accretion disc and corona sizes from literature (Shakura & Sunyaev 1973; Morgan et al. 2010; Dogruel et al. 2020).
Current usage metrics show cumulative count of Article Views (full-text article views including HTML views, PDF and ePub downloads, according to the available data) and Abstracts Views on Vision4Press platform.
Data correspond to usage on the plateform after 2015. The current usage metrics is available 48-96 hours after online publication and is updated daily on week days.
Initial download of the metrics may take a while.