Fig. 1
Download original image
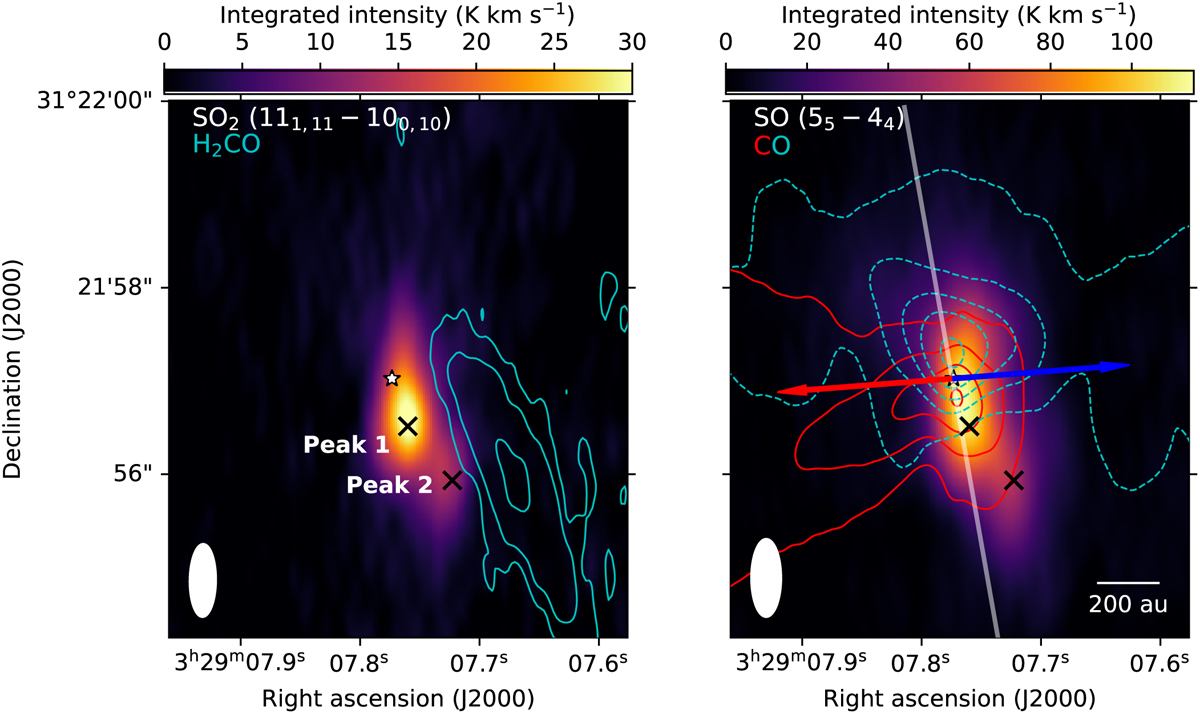
NOEMA observations of molecular emission toward Per-emb 50. Left: integrated intensity of SO2 111,11–100,10 between 6.5 and 12 km s−1. Black crosses show the locations of the SO2 peaks, labeled as peak 1 and peak 2. Cyan contours represent the H2CO 30,3–20,2 integrated intensity between 5 and 8 km s−1, drawn in steps of 3, 5, and 10 times the rms of the integrated image (0.7 K km s−1). Right: integrated intensity of SO 55–44 between 0 and 13 km s−1. The red and cyan contours are the CO integrated intensity in redshifted and blueshifted channels, respectively, with respect to the protostar’s vLSR (7.5 km s−1). Blueshifted channels are integrated between −4.3 and 5.3 km s−1, and redshifted channels between 10 and 20 km s−1. Contours are drawn at 5–45 times the rms of the integrated images (4.7 K km s−1) in steps of 10. Red and blue arrows indicate the direction of the outflow. The dashed line represents the direction of the PV diagram in Fig. 2. The white star marks the position of the continuum peak. The filled white ellipse represents the beam size. A scale bar in the bottom right corner represents a physical scale of 200 au.
Current usage metrics show cumulative count of Article Views (full-text article views including HTML views, PDF and ePub downloads, according to the available data) and Abstracts Views on Vision4Press platform.
Data correspond to usage on the plateform after 2015. The current usage metrics is available 48-96 hours after online publication and is updated daily on week days.
Initial download of the metrics may take a while.