Fig. B.1
Download original image
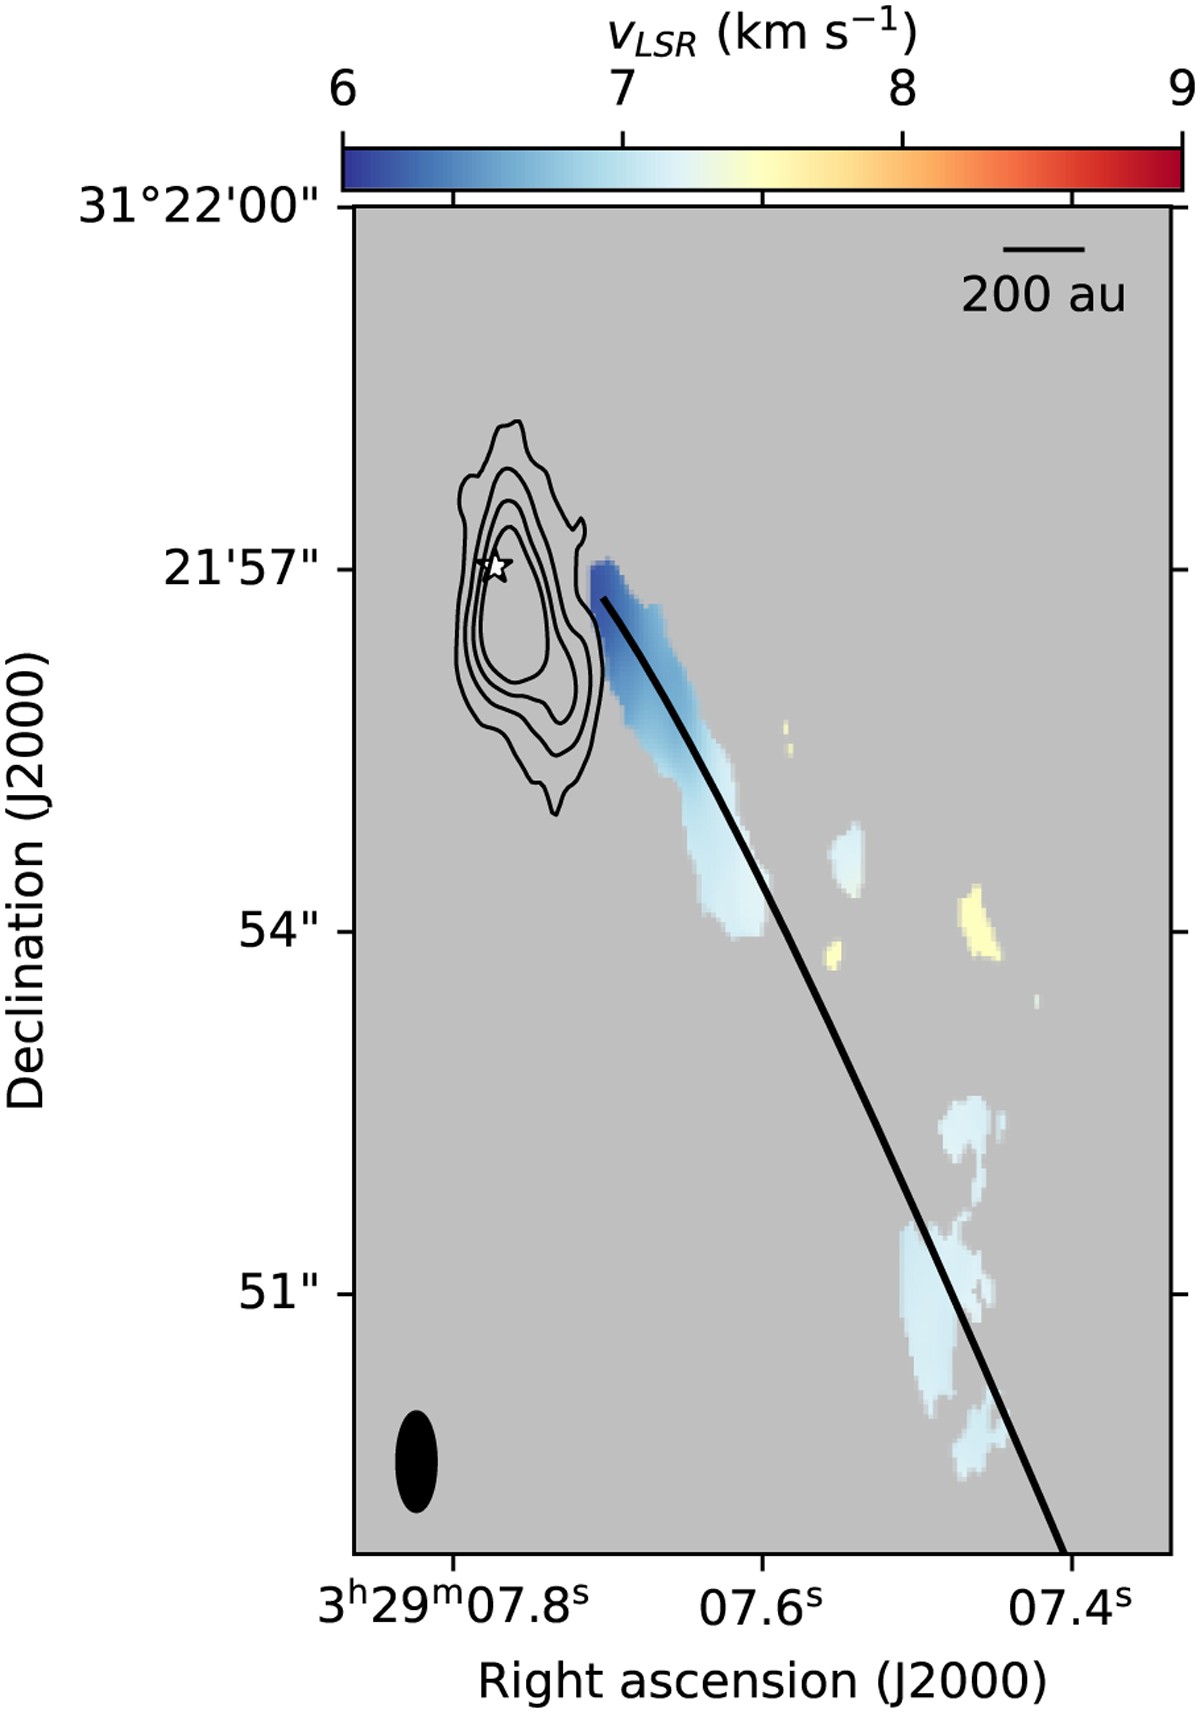
Best-fit central velocity for the Gaussian fit to H2CO 30,3–20,2, for emission with S/N> 5. Black contours mark 5, 10, 15 and 20 times the rms level (0.8 K km s−1) of the SO2 111,11–100,10 integrated intensity image from Fig. 1. The black curve represents the streamer trajectory from Valdivia-Mena et al. (2022). An ellipse in the bottom-left corner represents the beam. The scale bar in the top right shows a length of 200 au.
Current usage metrics show cumulative count of Article Views (full-text article views including HTML views, PDF and ePub downloads, according to the available data) and Abstracts Views on Vision4Press platform.
Data correspond to usage on the plateform after 2015. The current usage metrics is available 48-96 hours after online publication and is updated daily on week days.
Initial download of the metrics may take a while.