Fig. 3
Download original image
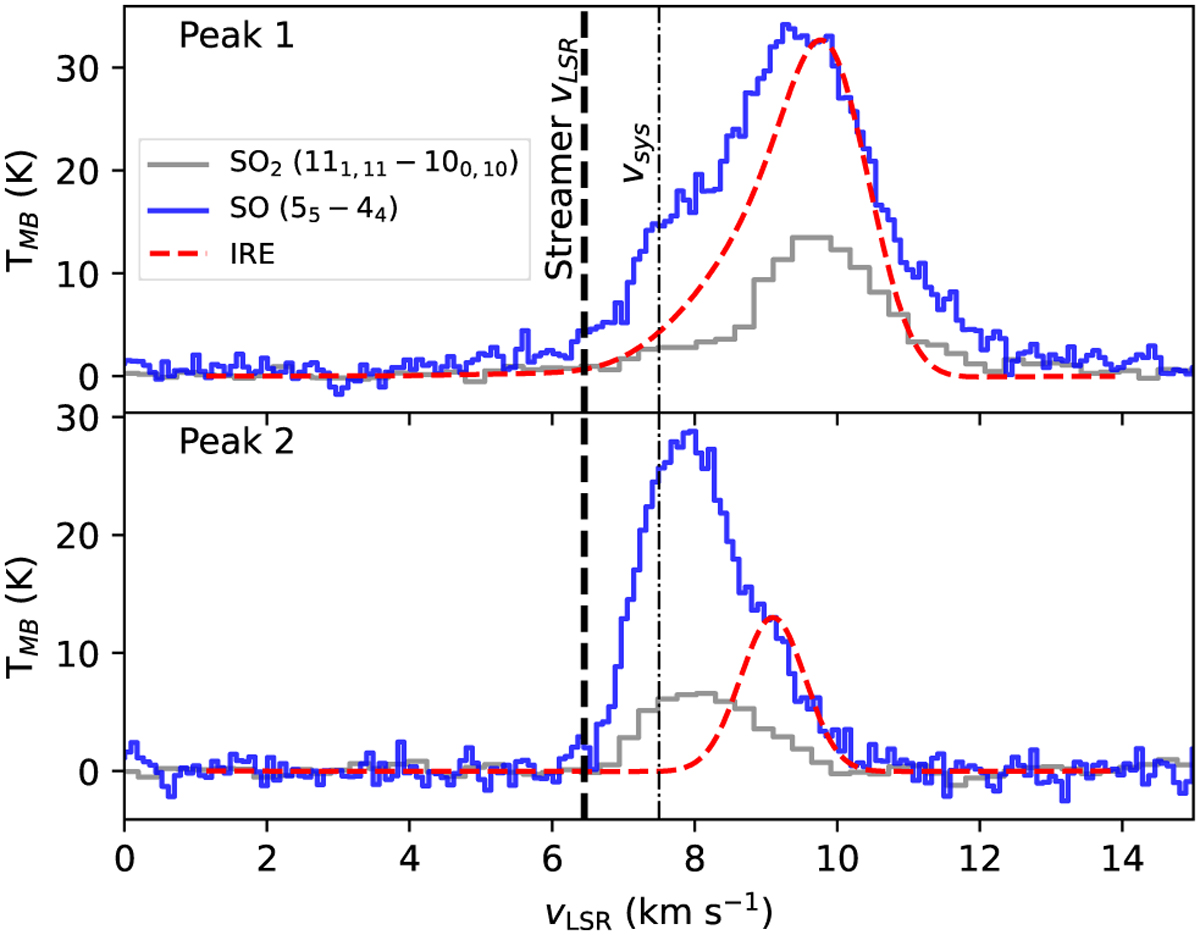
Spectra of SO 55–44 (blue) and SO2 111,11–100,10 (gray) at the two resolved peak positions, together with the spectra obtained from FERIA, normalized to the SO intensity at the peak velocity of the IRE. The vertical dash-dotted line marks the systemic velocity of the protostar (7.5 km s−1), whereas the thick dashed line marks the velocity of the streamer at the same distance from the protostar (in radius) as peak 2 (6.45 km s−1; Appendix B).
Current usage metrics show cumulative count of Article Views (full-text article views including HTML views, PDF and ePub downloads, according to the available data) and Abstracts Views on Vision4Press platform.
Data correspond to usage on the plateform after 2015. The current usage metrics is available 48-96 hours after online publication and is updated daily on week days.
Initial download of the metrics may take a while.