Open Access
Fig. 4
Download original image
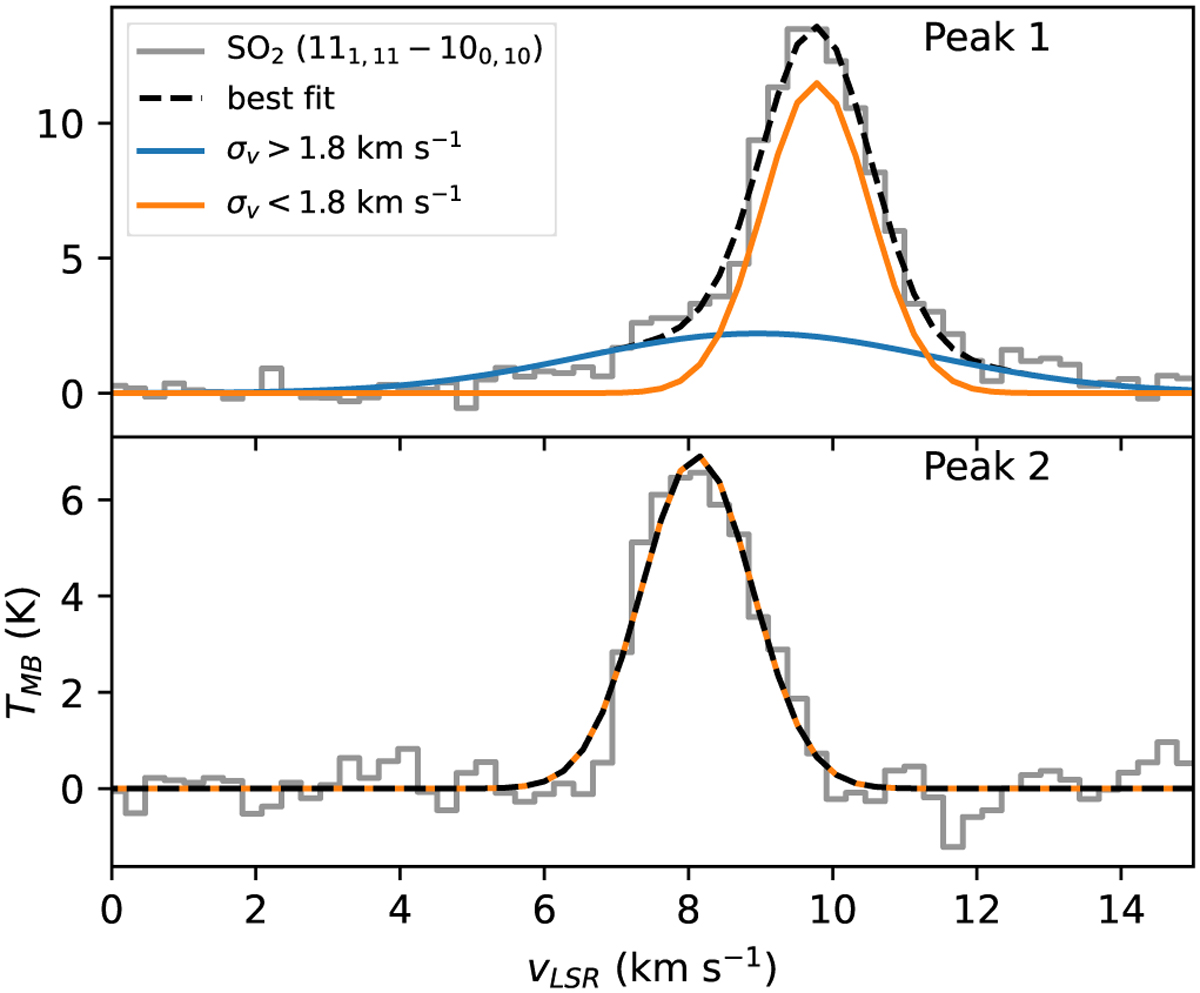
SO2 spectra (gray) at the location of the peaks together with the best-fit (dashed black lines) Gaussian models. Peak 1 has two Gaussian components, a narrow one (orange, σv < 1.8 km s−1) and a wide one (blue, σv > 1.8 km s−1), whereas peak 2 has just one component (narrow).
Current usage metrics show cumulative count of Article Views (full-text article views including HTML views, PDF and ePub downloads, according to the available data) and Abstracts Views on Vision4Press platform.
Data correspond to usage on the plateform after 2015. The current usage metrics is available 48-96 hours after online publication and is updated daily on week days.
Initial download of the metrics may take a while.