Open Access
Fig. 6
Download original image
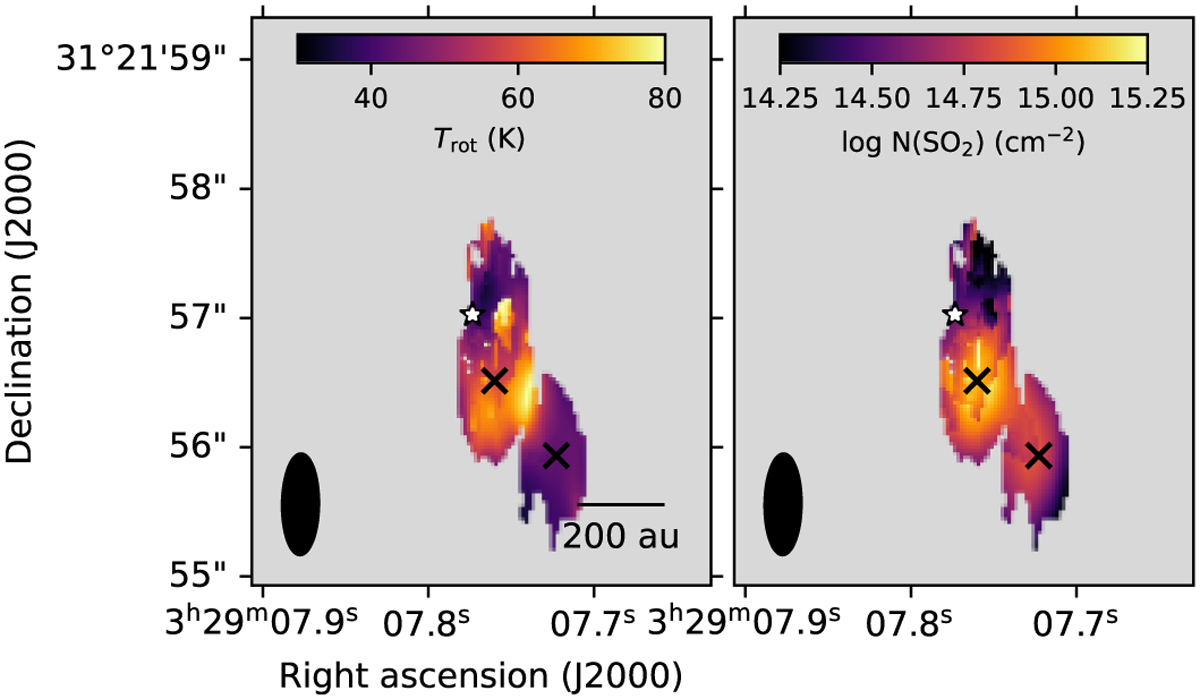
Parameters derived from LTE calculations of all SO2 transitions. Peak positions are marked as in Fig. 1. The black ellipse represents the beam size. A scale bar represents a length of 200 au. Crosses represent the locations of the SO2 peaks. Left: rotational temperature. Right: base 10 logarithm of the SO2 column density.
Current usage metrics show cumulative count of Article Views (full-text article views including HTML views, PDF and ePub downloads, according to the available data) and Abstracts Views on Vision4Press platform.
Data correspond to usage on the plateform after 2015. The current usage metrics is available 48-96 hours after online publication and is updated daily on week days.
Initial download of the metrics may take a while.