Fig. 7
Download original image
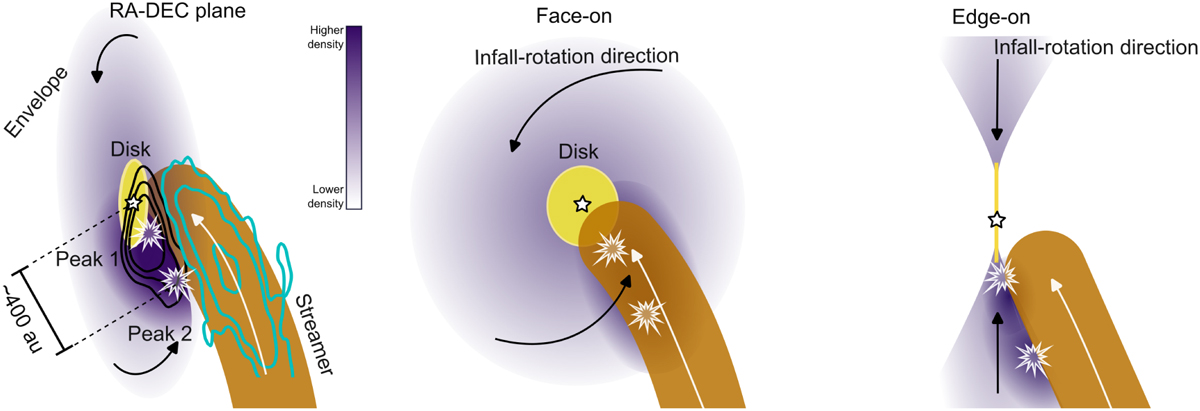
Schematic of the proposed interpretation of SO2 emission: the envelope (purple) impacts the streamer (brown) from the side as the latter falls toward the disk, causing a higher density and temperature and generating a SO2 peak ar around 400 au from the protostar (white star). It is unclear if peak 1, which is a shock, potentially in the disk-envelope interface, is caused by the streamer or not. The peaks are shown with white explosion signs and labeled. The black arrows indicate the direction of envelope infall-rotation motions. The white arrow indicates the general motion of the streamer. Black and cyan contours show the brightness distribution of SO2 and H2CO, respectively, from Fig. 1.
Current usage metrics show cumulative count of Article Views (full-text article views including HTML views, PDF and ePub downloads, according to the available data) and Abstracts Views on Vision4Press platform.
Data correspond to usage on the plateform after 2015. The current usage metrics is available 48-96 hours after online publication and is updated daily on week days.
Initial download of the metrics may take a while.