Fig. A.1
Download original image
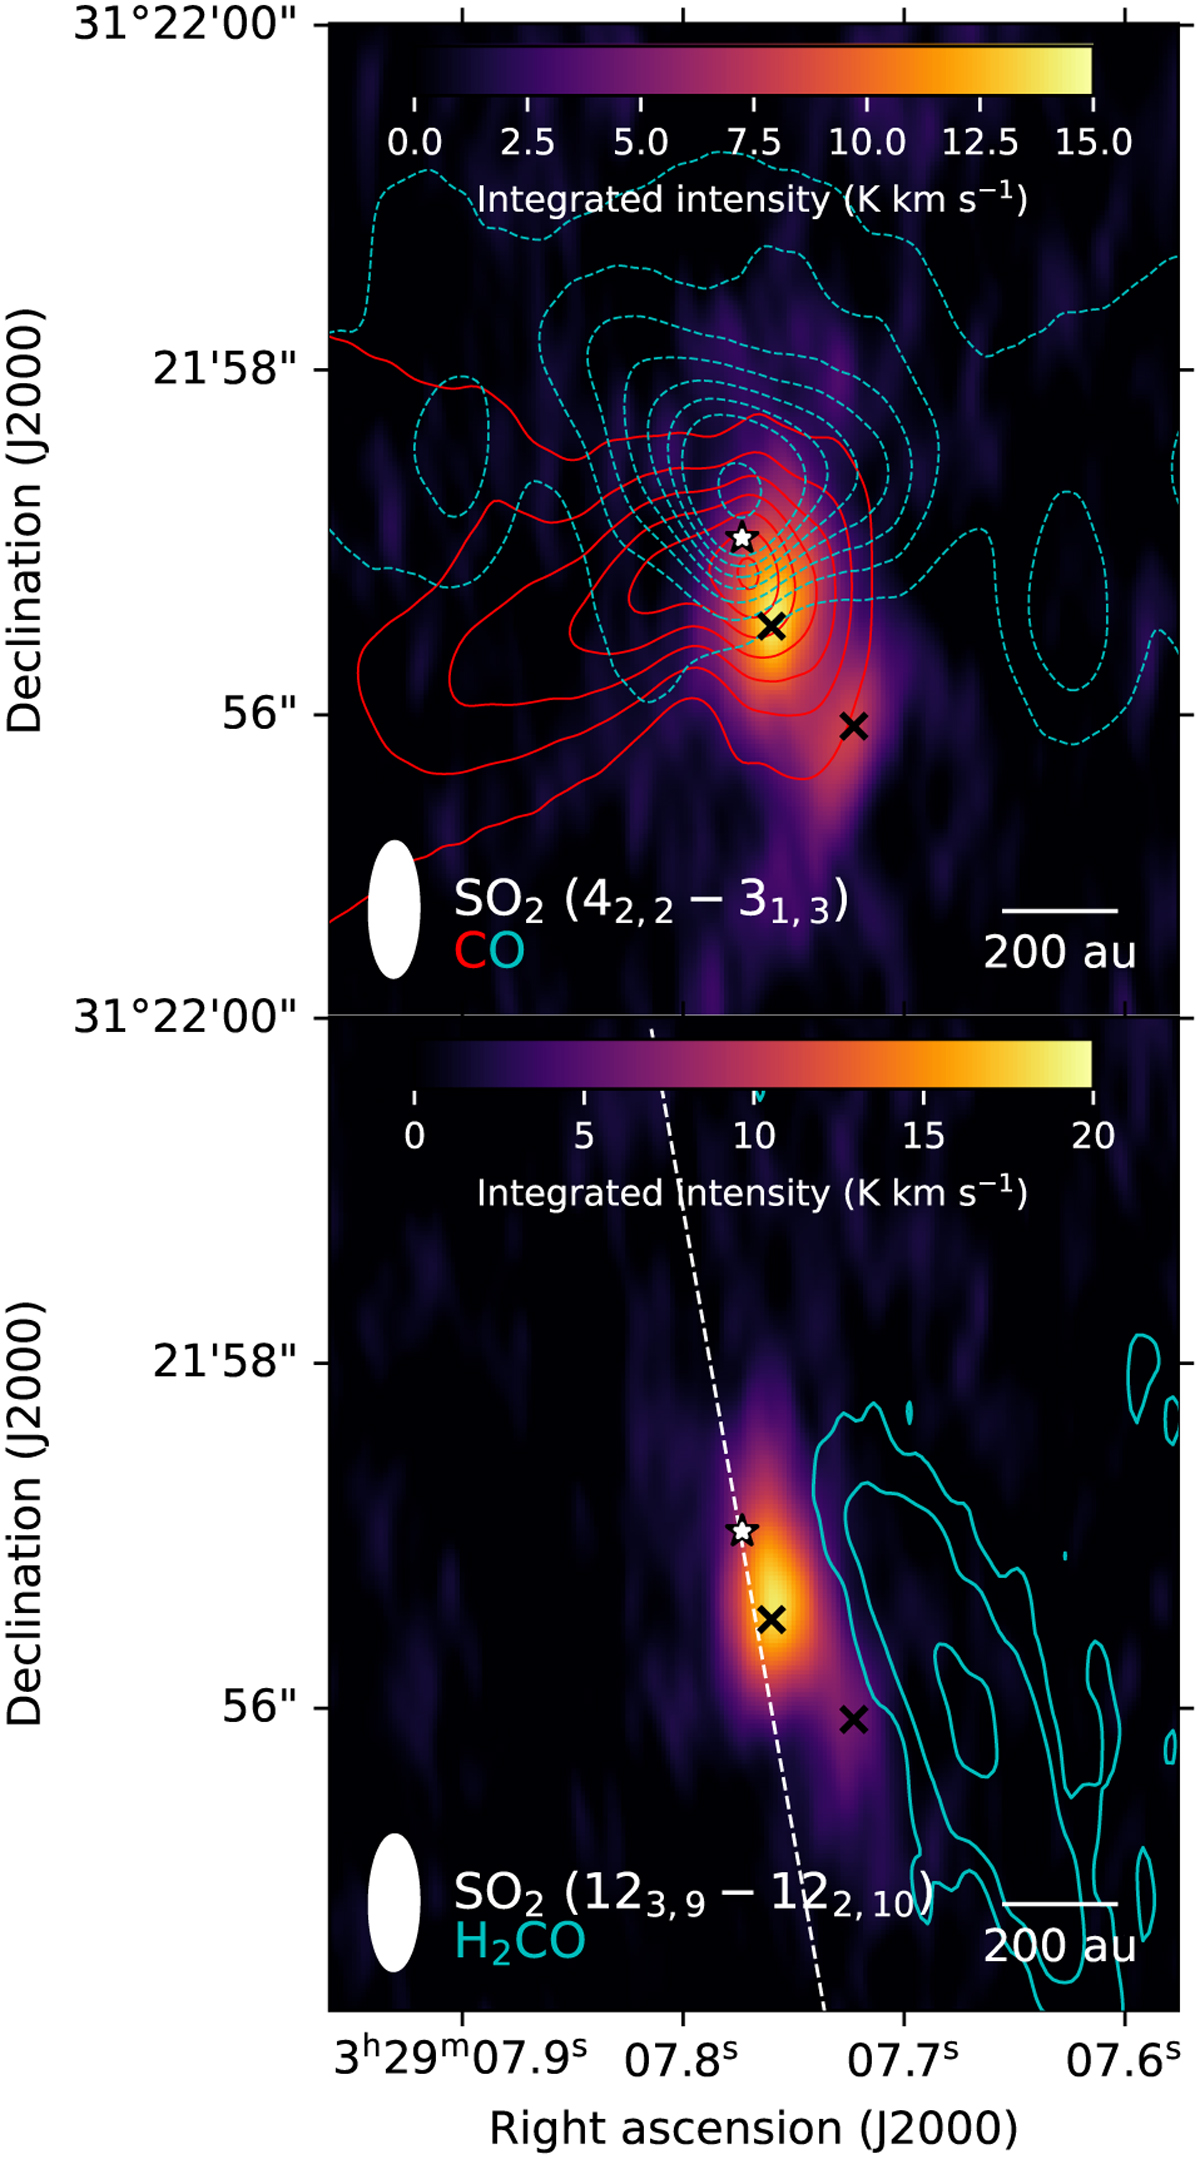
Integrated intensity of SO2 42,2 − 31,3 and 123,9 − 122,10, compared with CO and H2CO emission near the protostar. All SO2 transitions are integrated in the same velocity range as in Fig. 1. Crosses mark the locations of peaks 1 and 2. Top: SO2 42,2 − 31,3 integrated intensity map. Red and blue contours mark the same CO contours as in Fig. 1. Bottom: SO2 123,9 − 122,10 integrated intensity map. Blue contours represent the H2CO integrated intensity, with contours drawn at 3,5 and 10 times the rms of the map (0.7 K km s−1). The dashed line represents the direction of the PV diagram in Fig. 2.
Current usage metrics show cumulative count of Article Views (full-text article views including HTML views, PDF and ePub downloads, according to the available data) and Abstracts Views on Vision4Press platform.
Data correspond to usage on the plateform after 2015. The current usage metrics is available 48-96 hours after online publication and is updated daily on week days.
Initial download of the metrics may take a while.